Performance Charts & Methodology
To guarantee enterprise-grade reliability, Probo UI is rigorously benchmarked across scaling matrices ranging from 100 to 1,000,000 nested nodes.
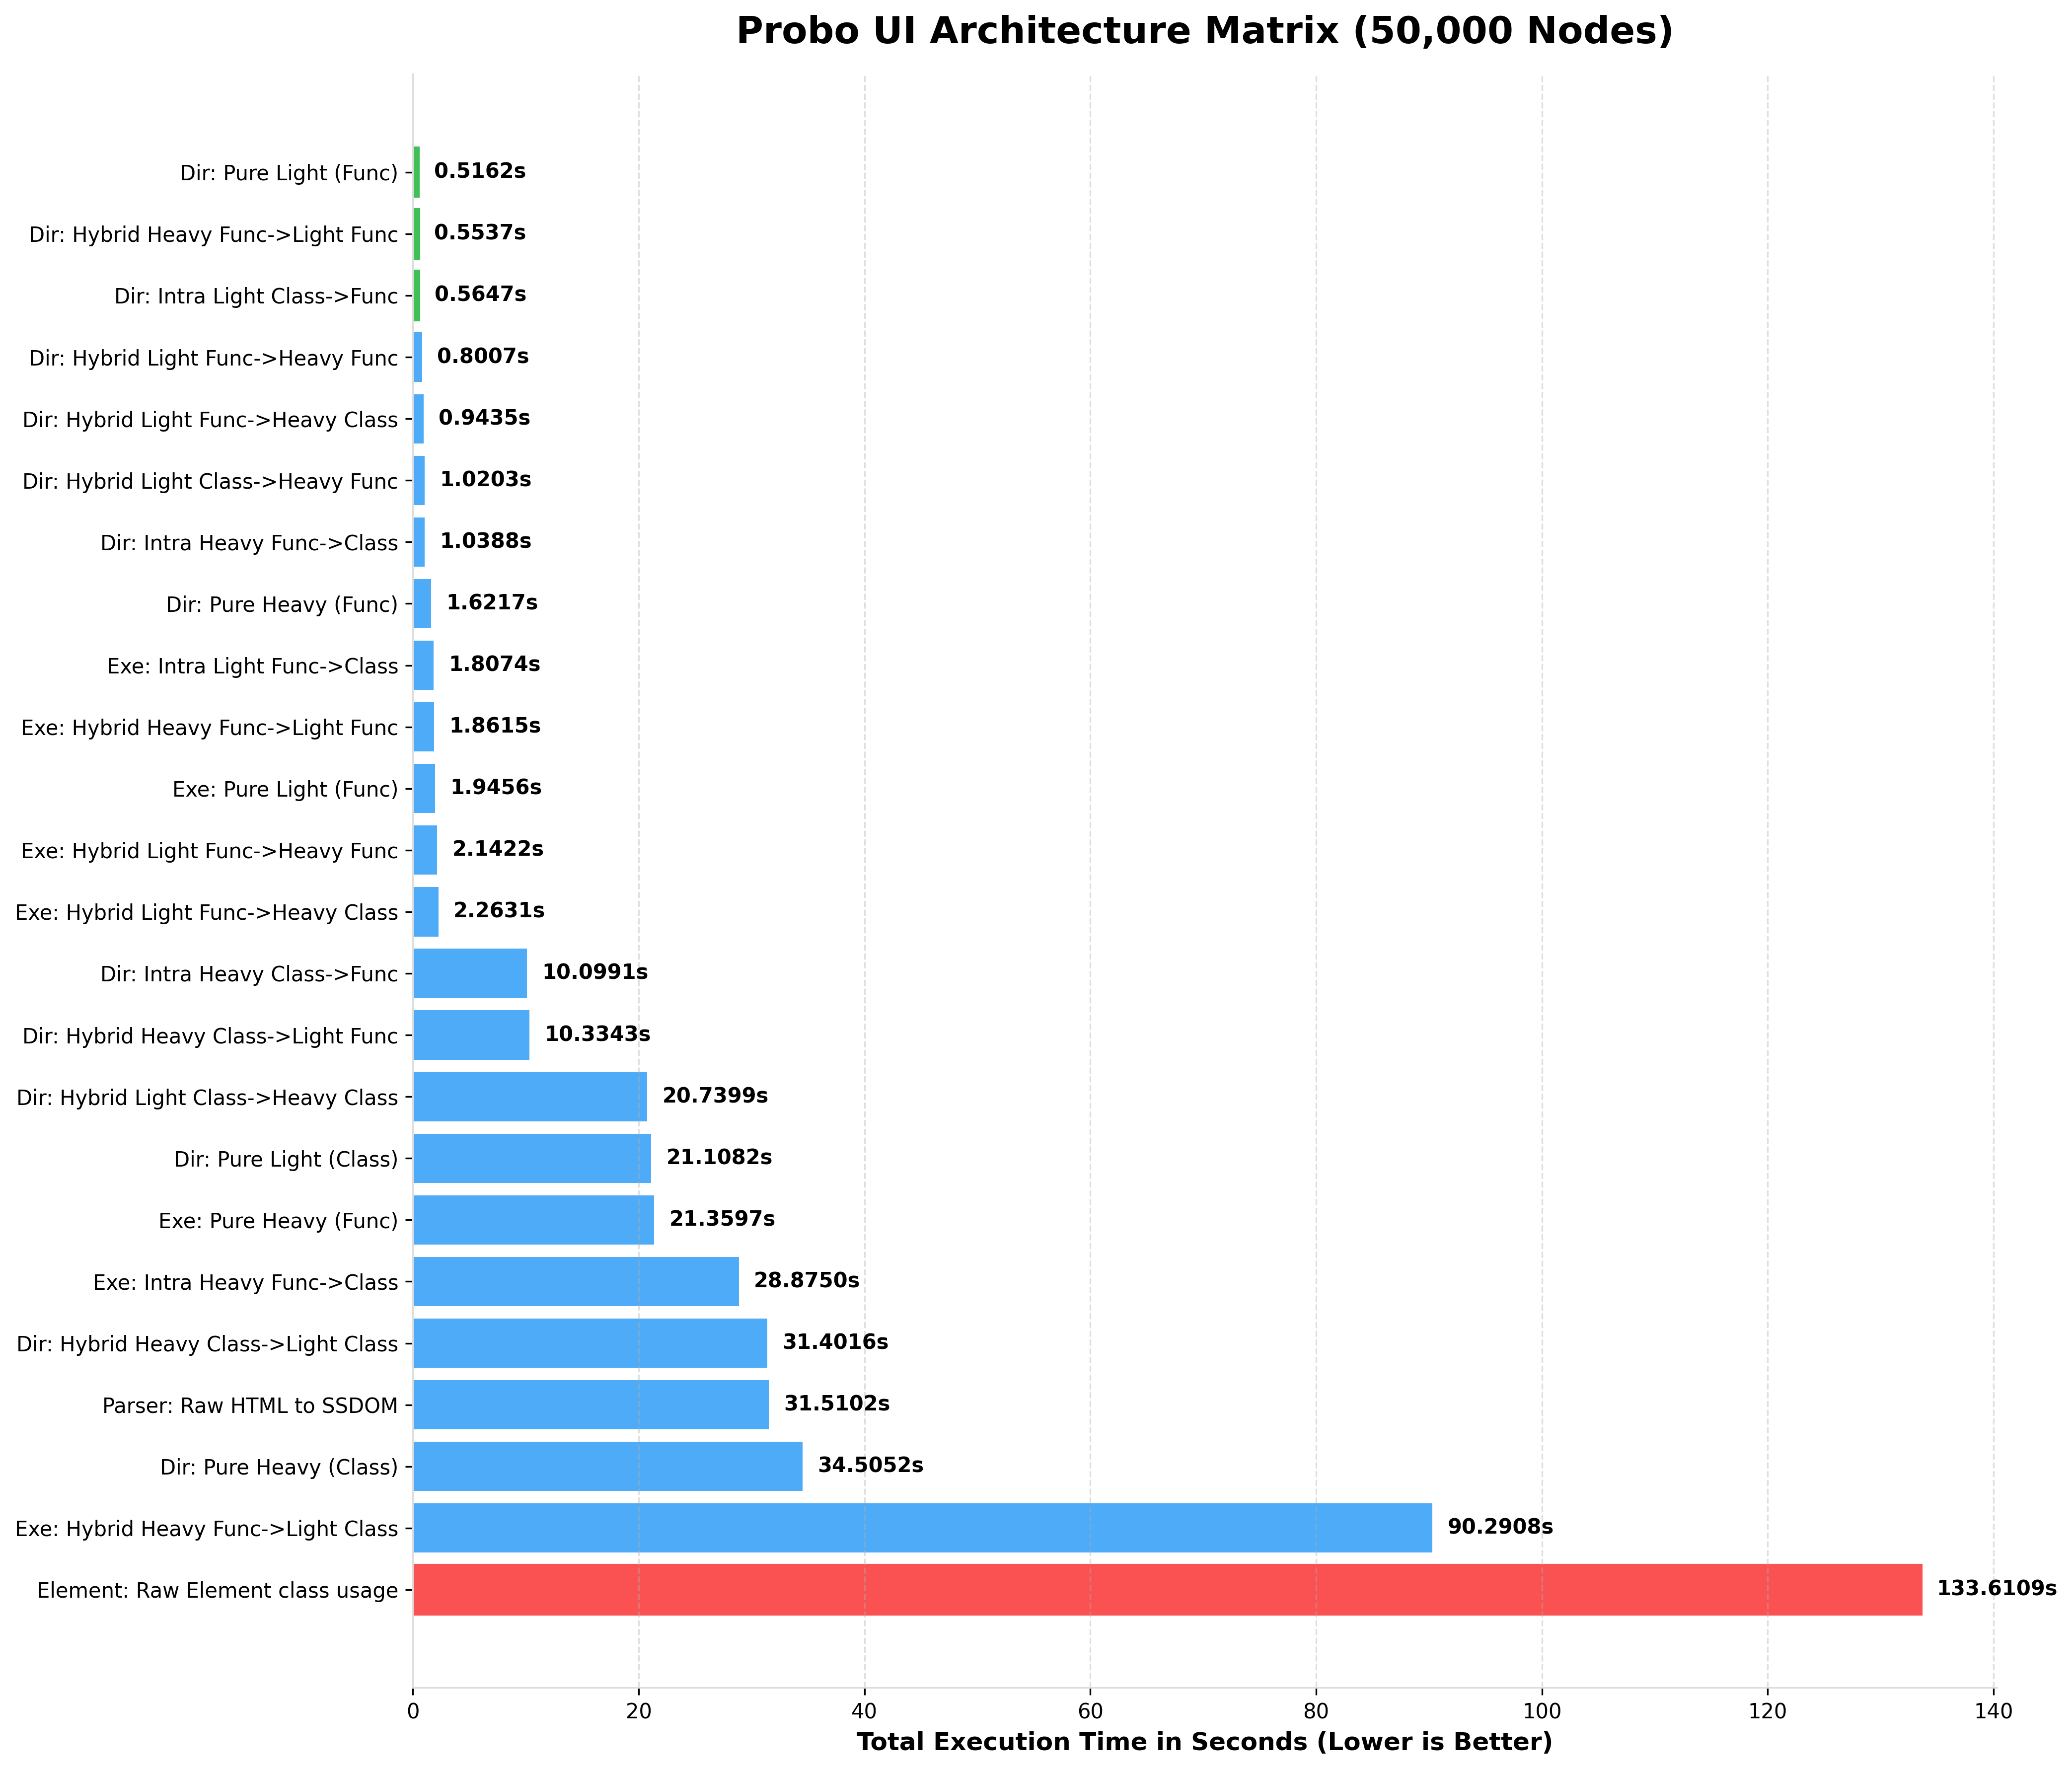
Because Probo offers different architectural paradigms (Heavy OOP vs. Light Functional), performance scales depending on the "Chimera" combination you choose.
Benchmark Results (Expected)
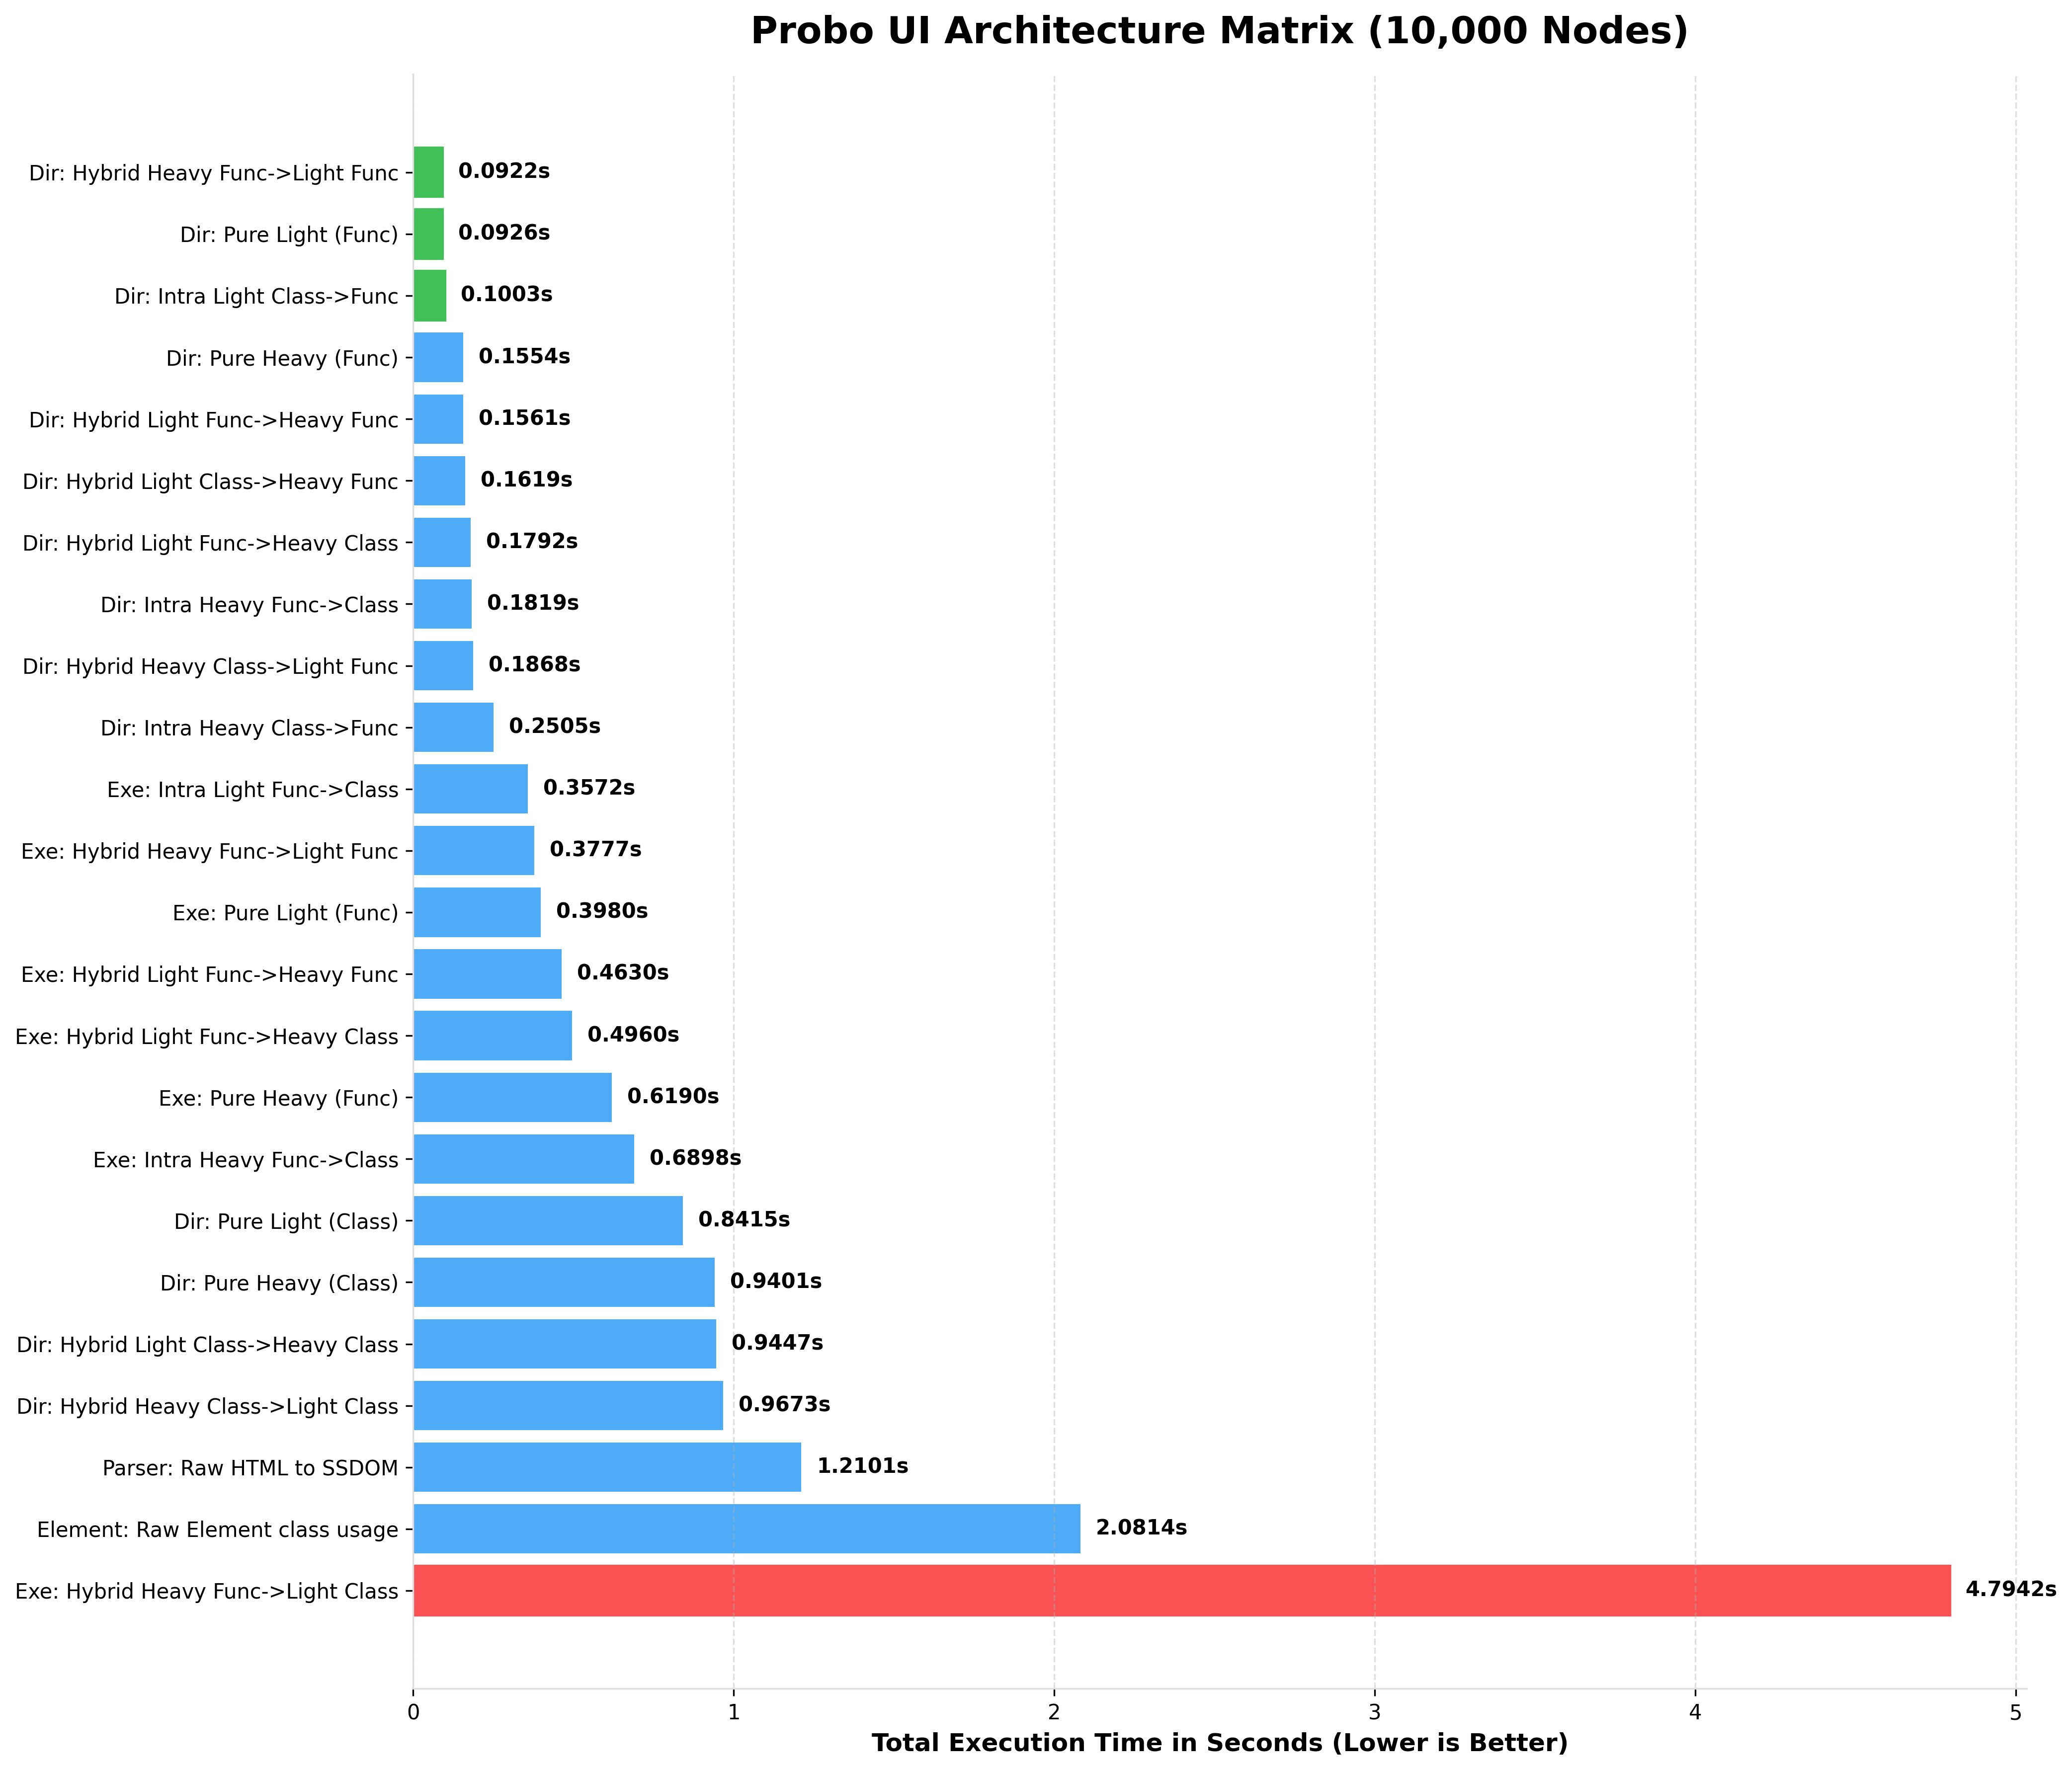
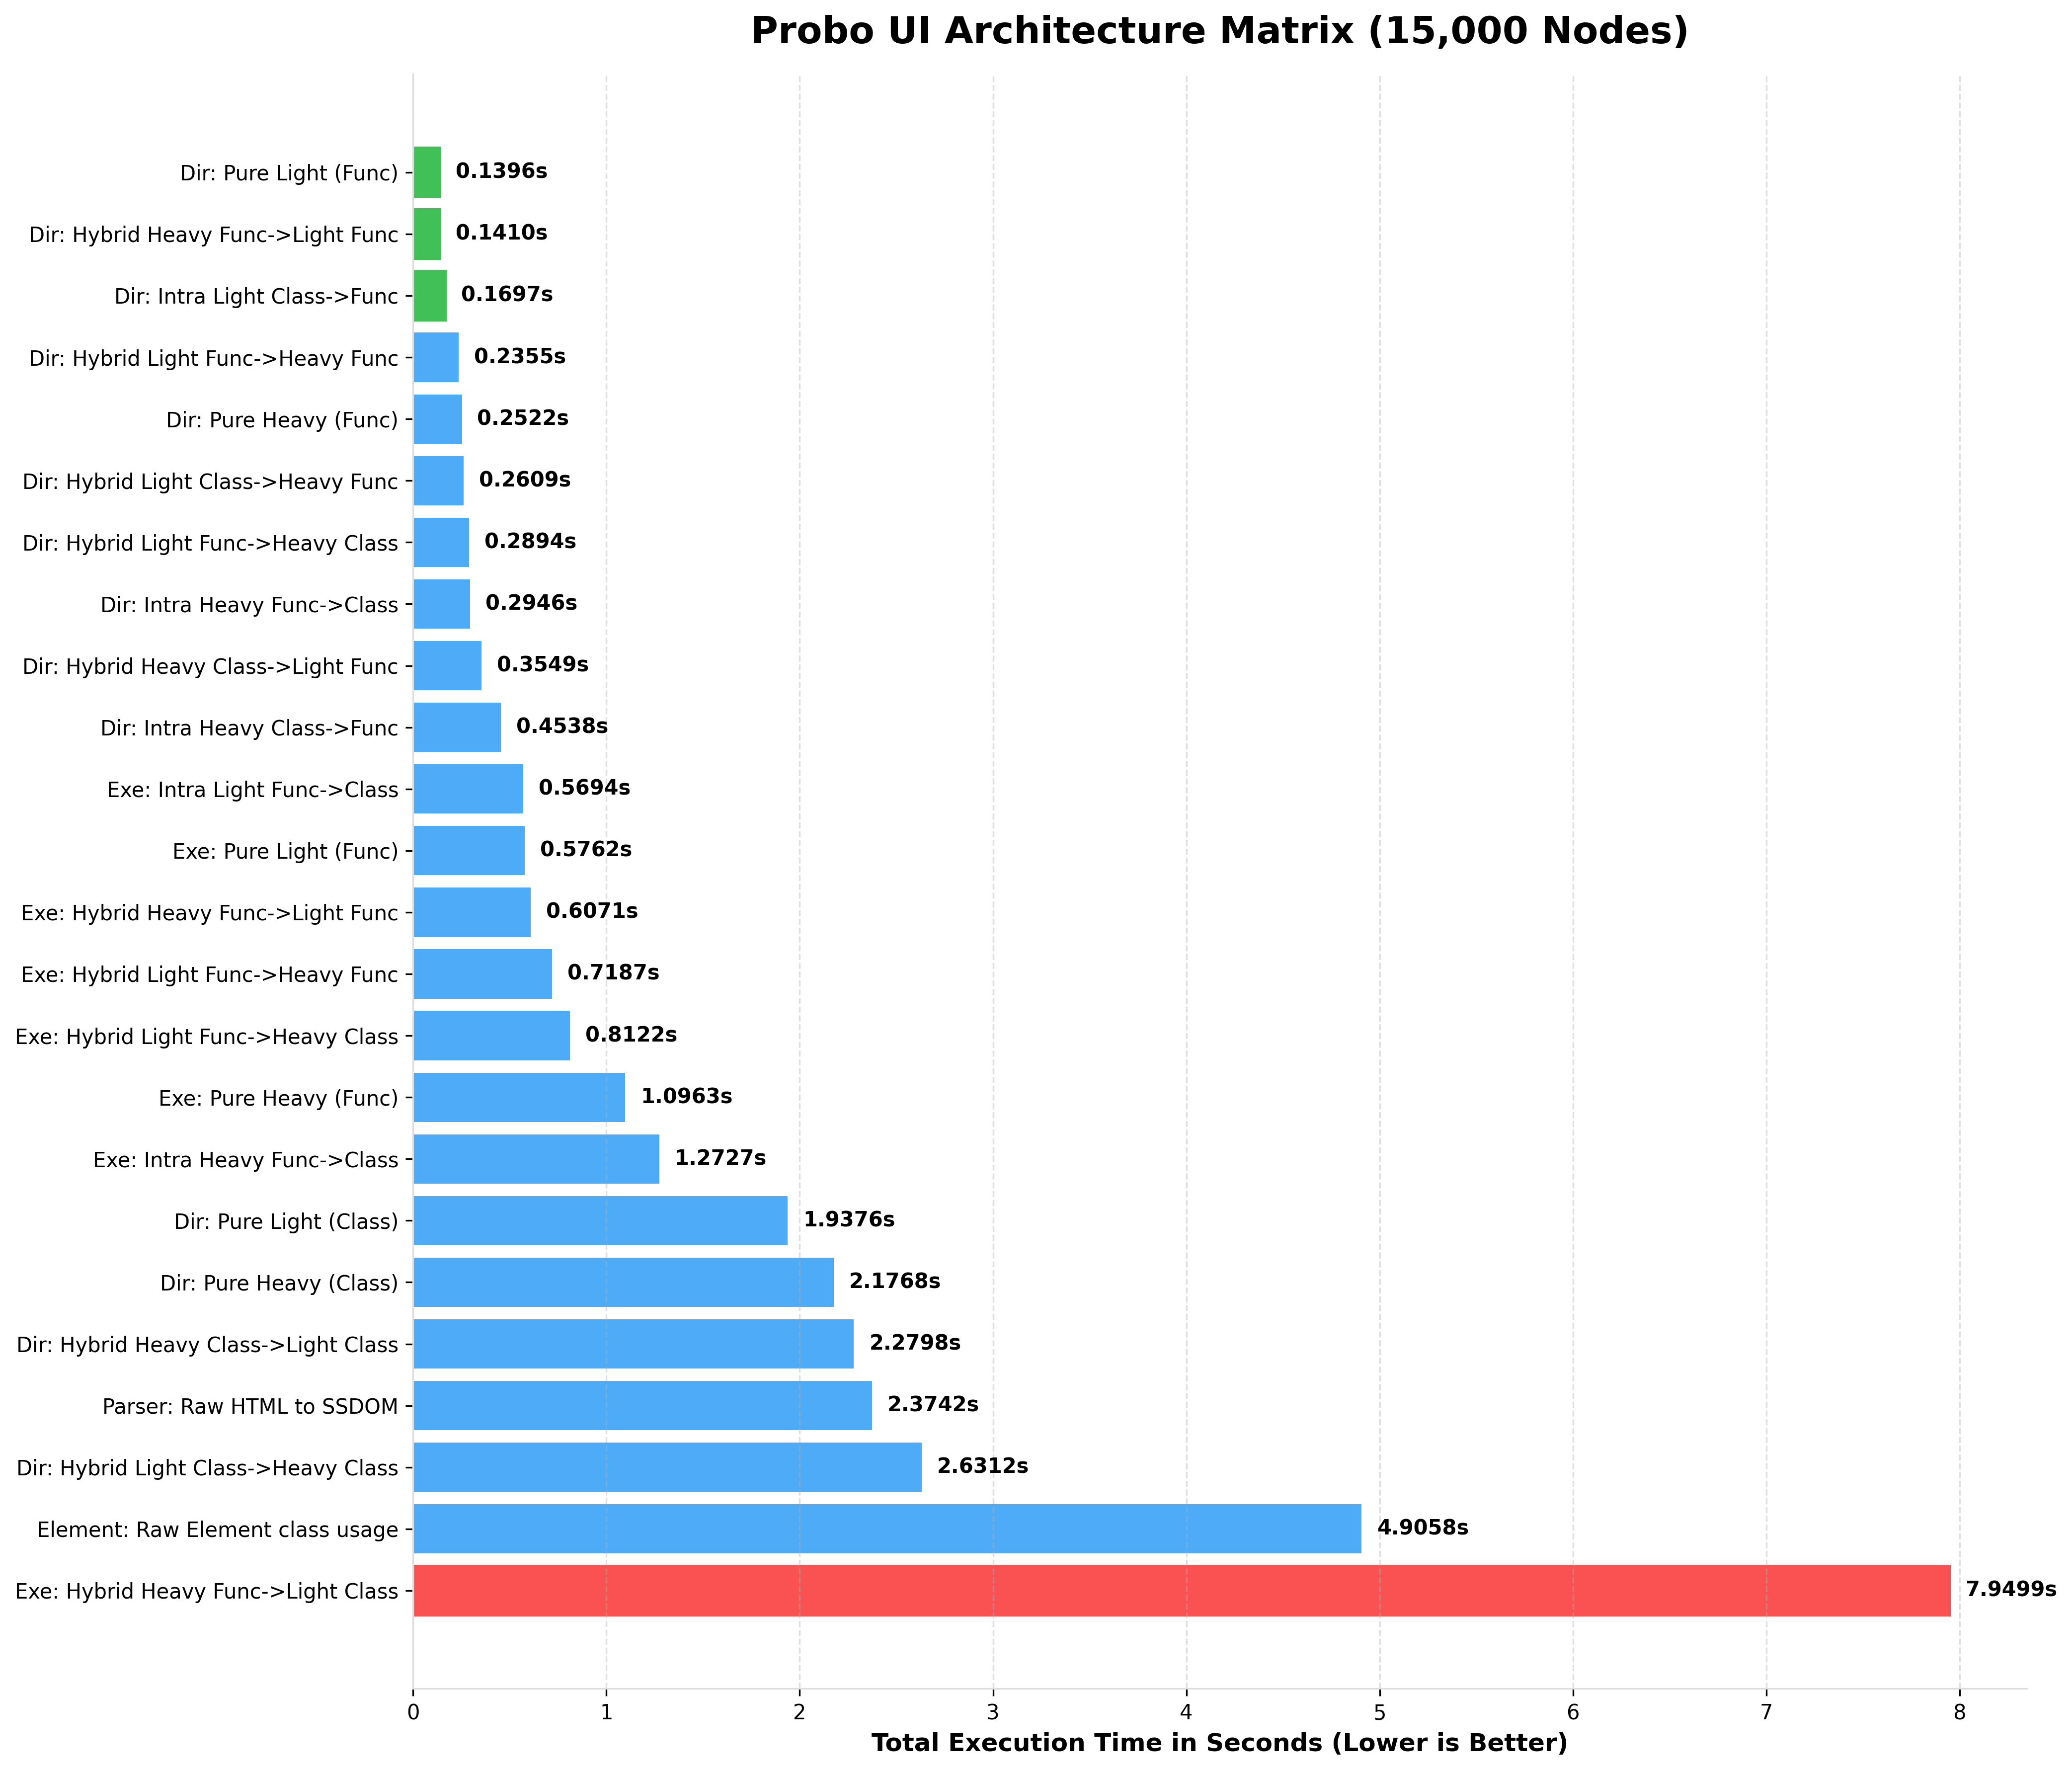
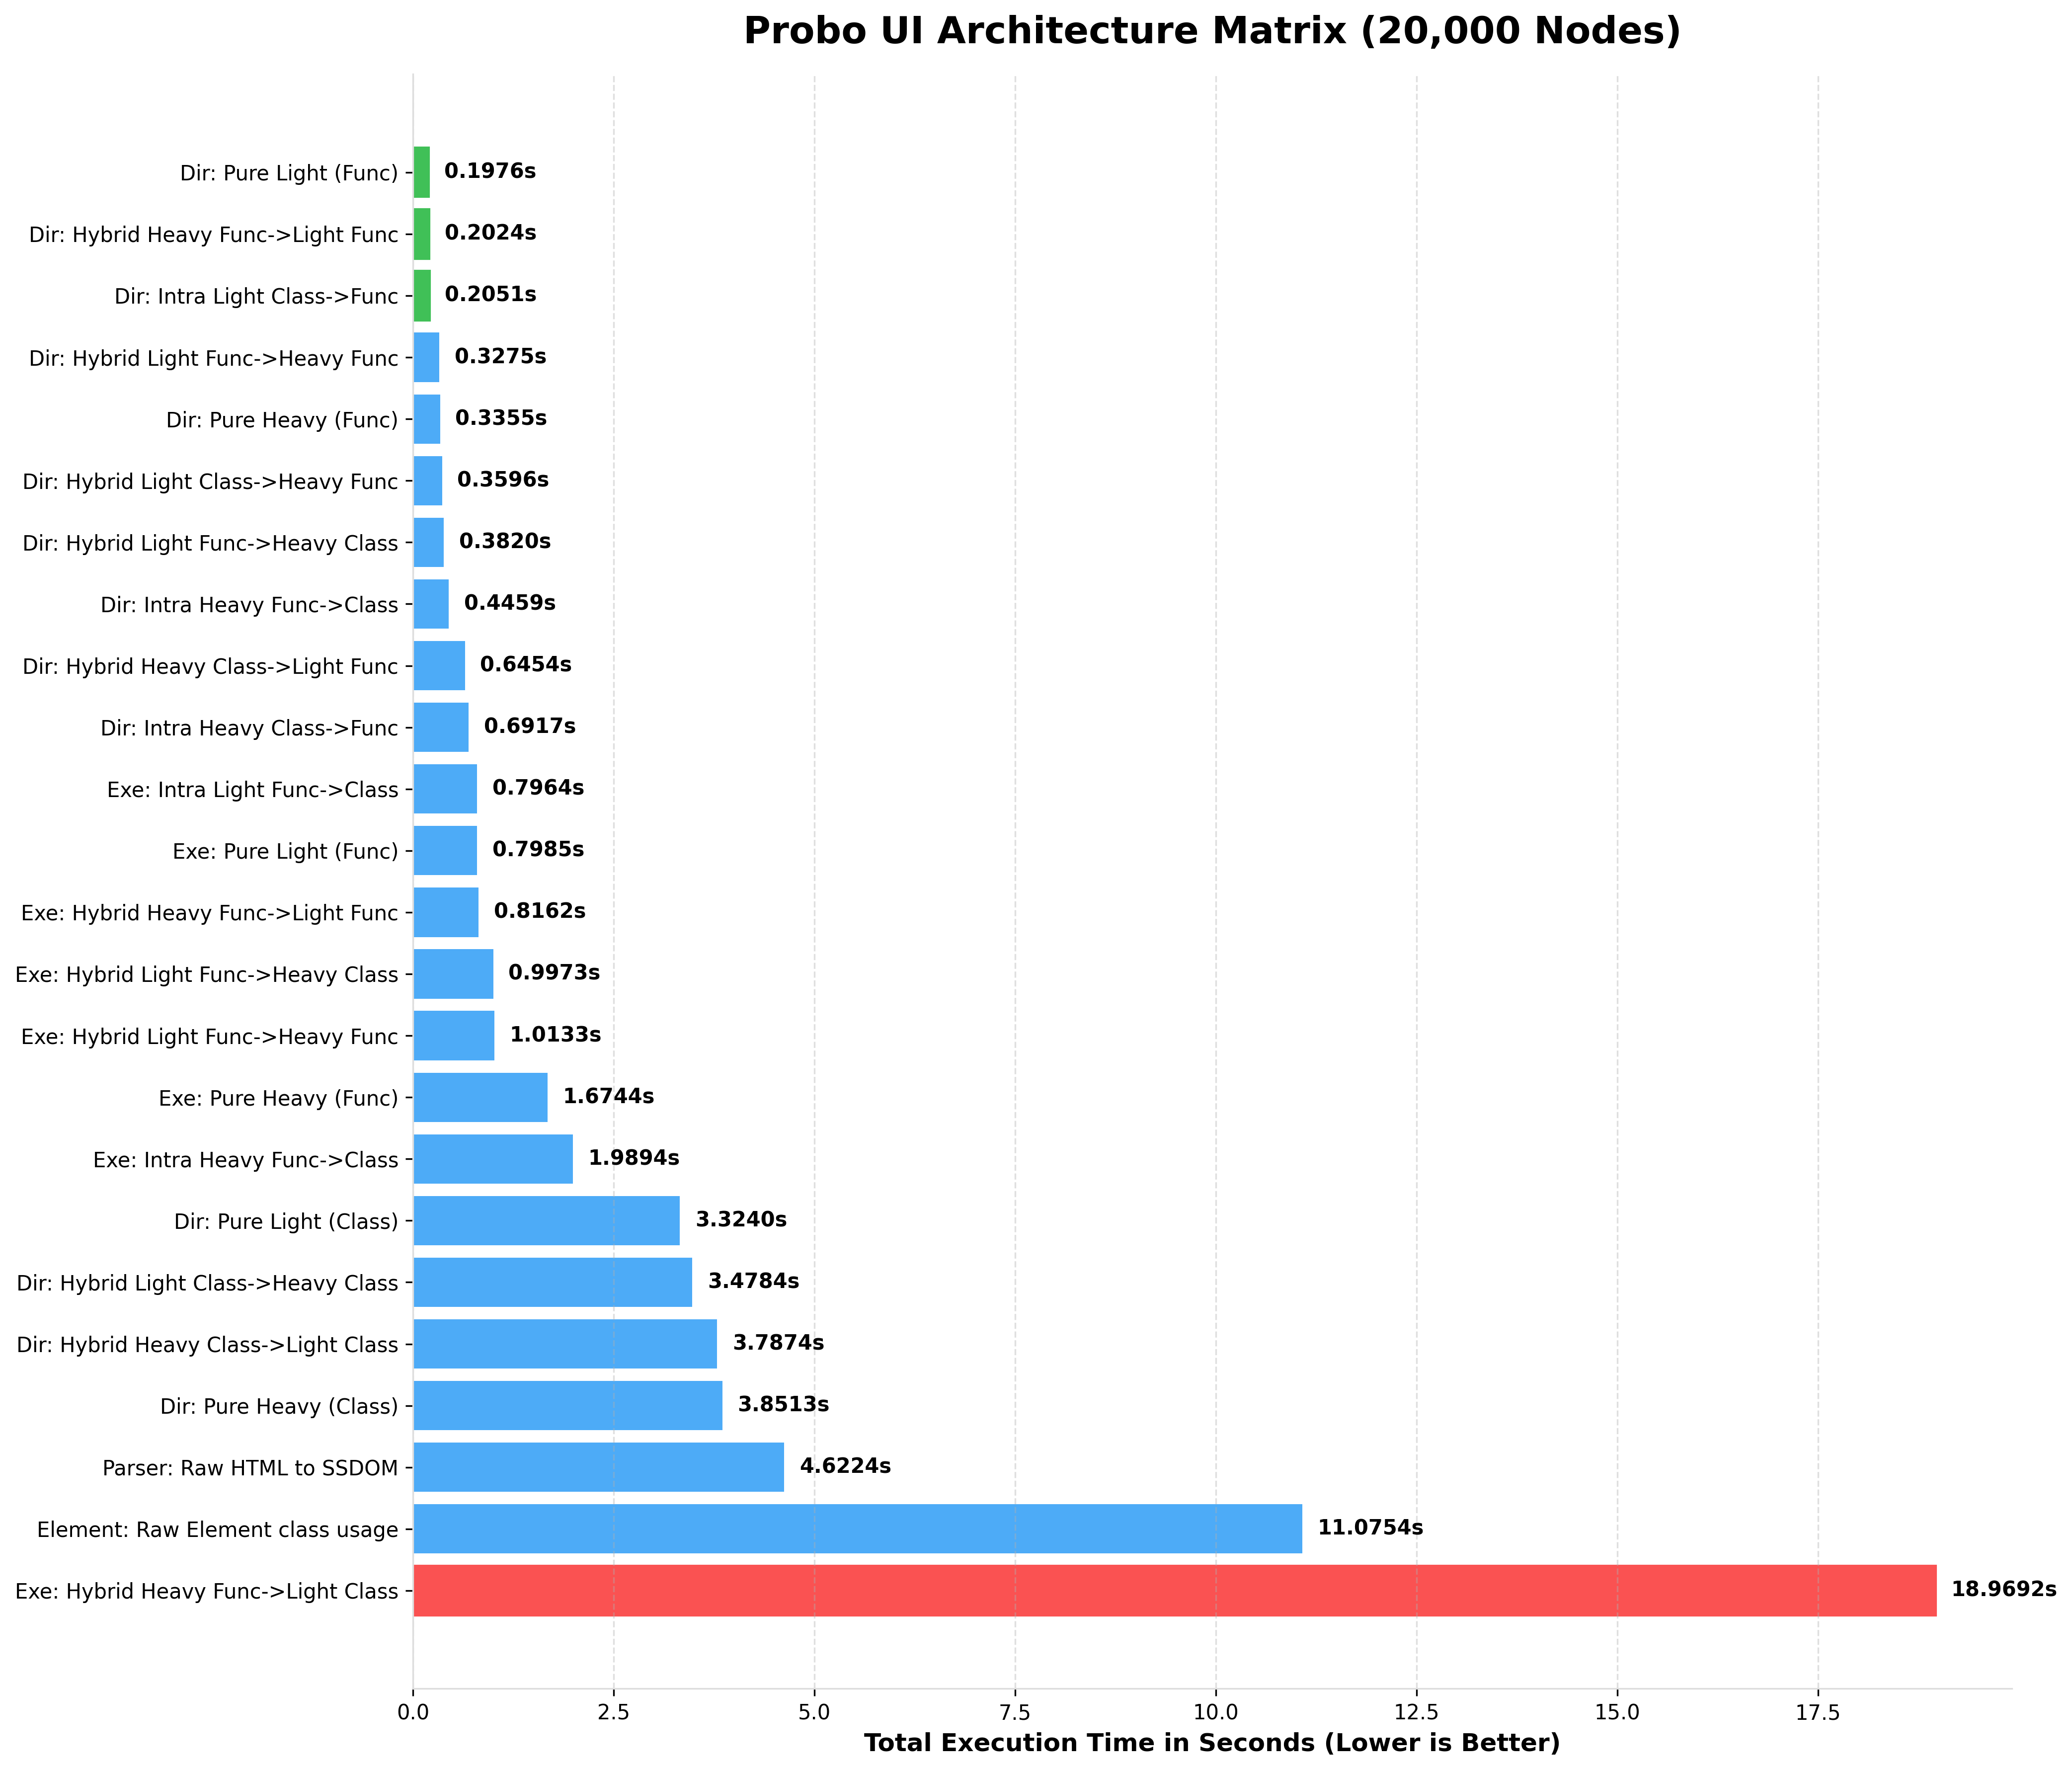
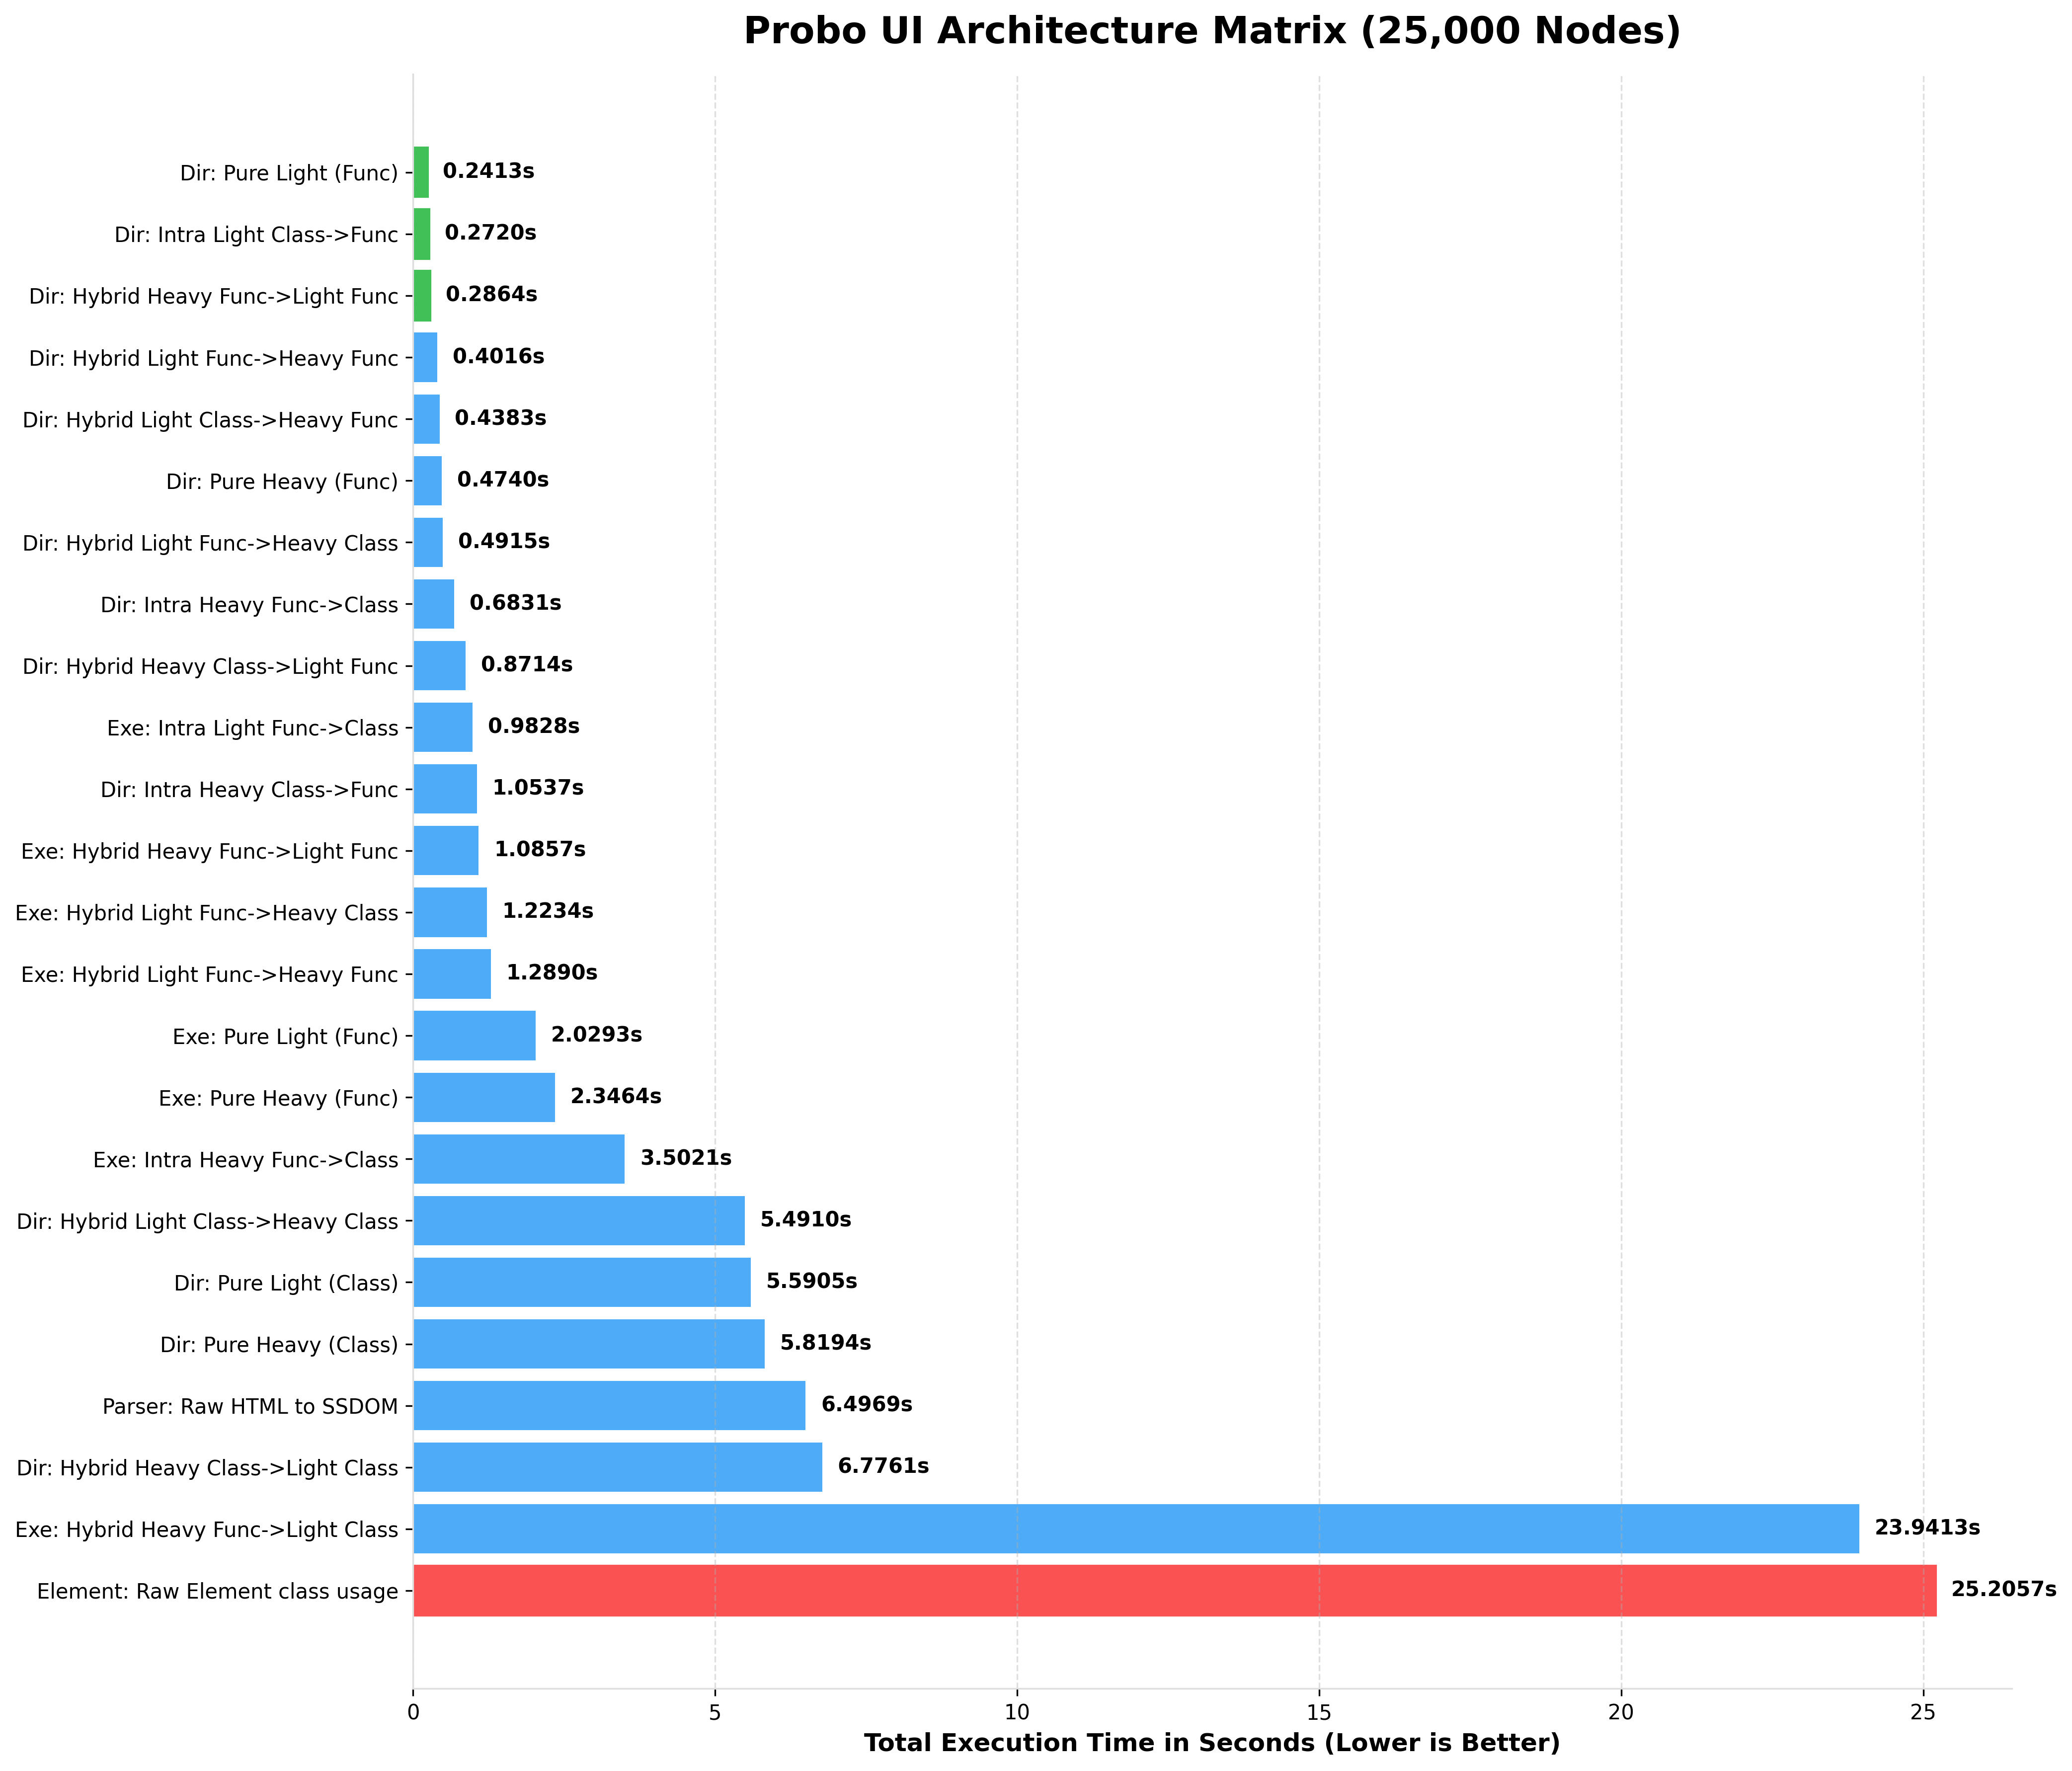
When running the Ultimate Performance Matrix on a standard modern CPU, here is the performance scaling you can expect.
Notice how Light Functional and Raw Element architectures maintain blistering speeds even at massive scales, while Heavy OOP intentionally trades speed for deep SSDOM mutation capabilities.
| Architecture (Root -> Child) | Best Use Case |
|---|---|
Pure Light (Func) (l_div) |
Massive data streams |
Raw Element API (Element) |
Ultra-low level generation |
| Hybrid (Heavy -> Light Func) | Standard chimera apps |
Pure Heavy (Class) (DIV) |
Complex layout wrappers |
| Parser (HTML -> SSDOM) | Legacy file parsing |
| Chimera | a middlegroud for all above |
| Functional executer | a way to build using all above |
(Note: "benchmark results" includes both tree initialization and string compilation/rendering and their include at bottom after script is posted).
The Real-World Context:
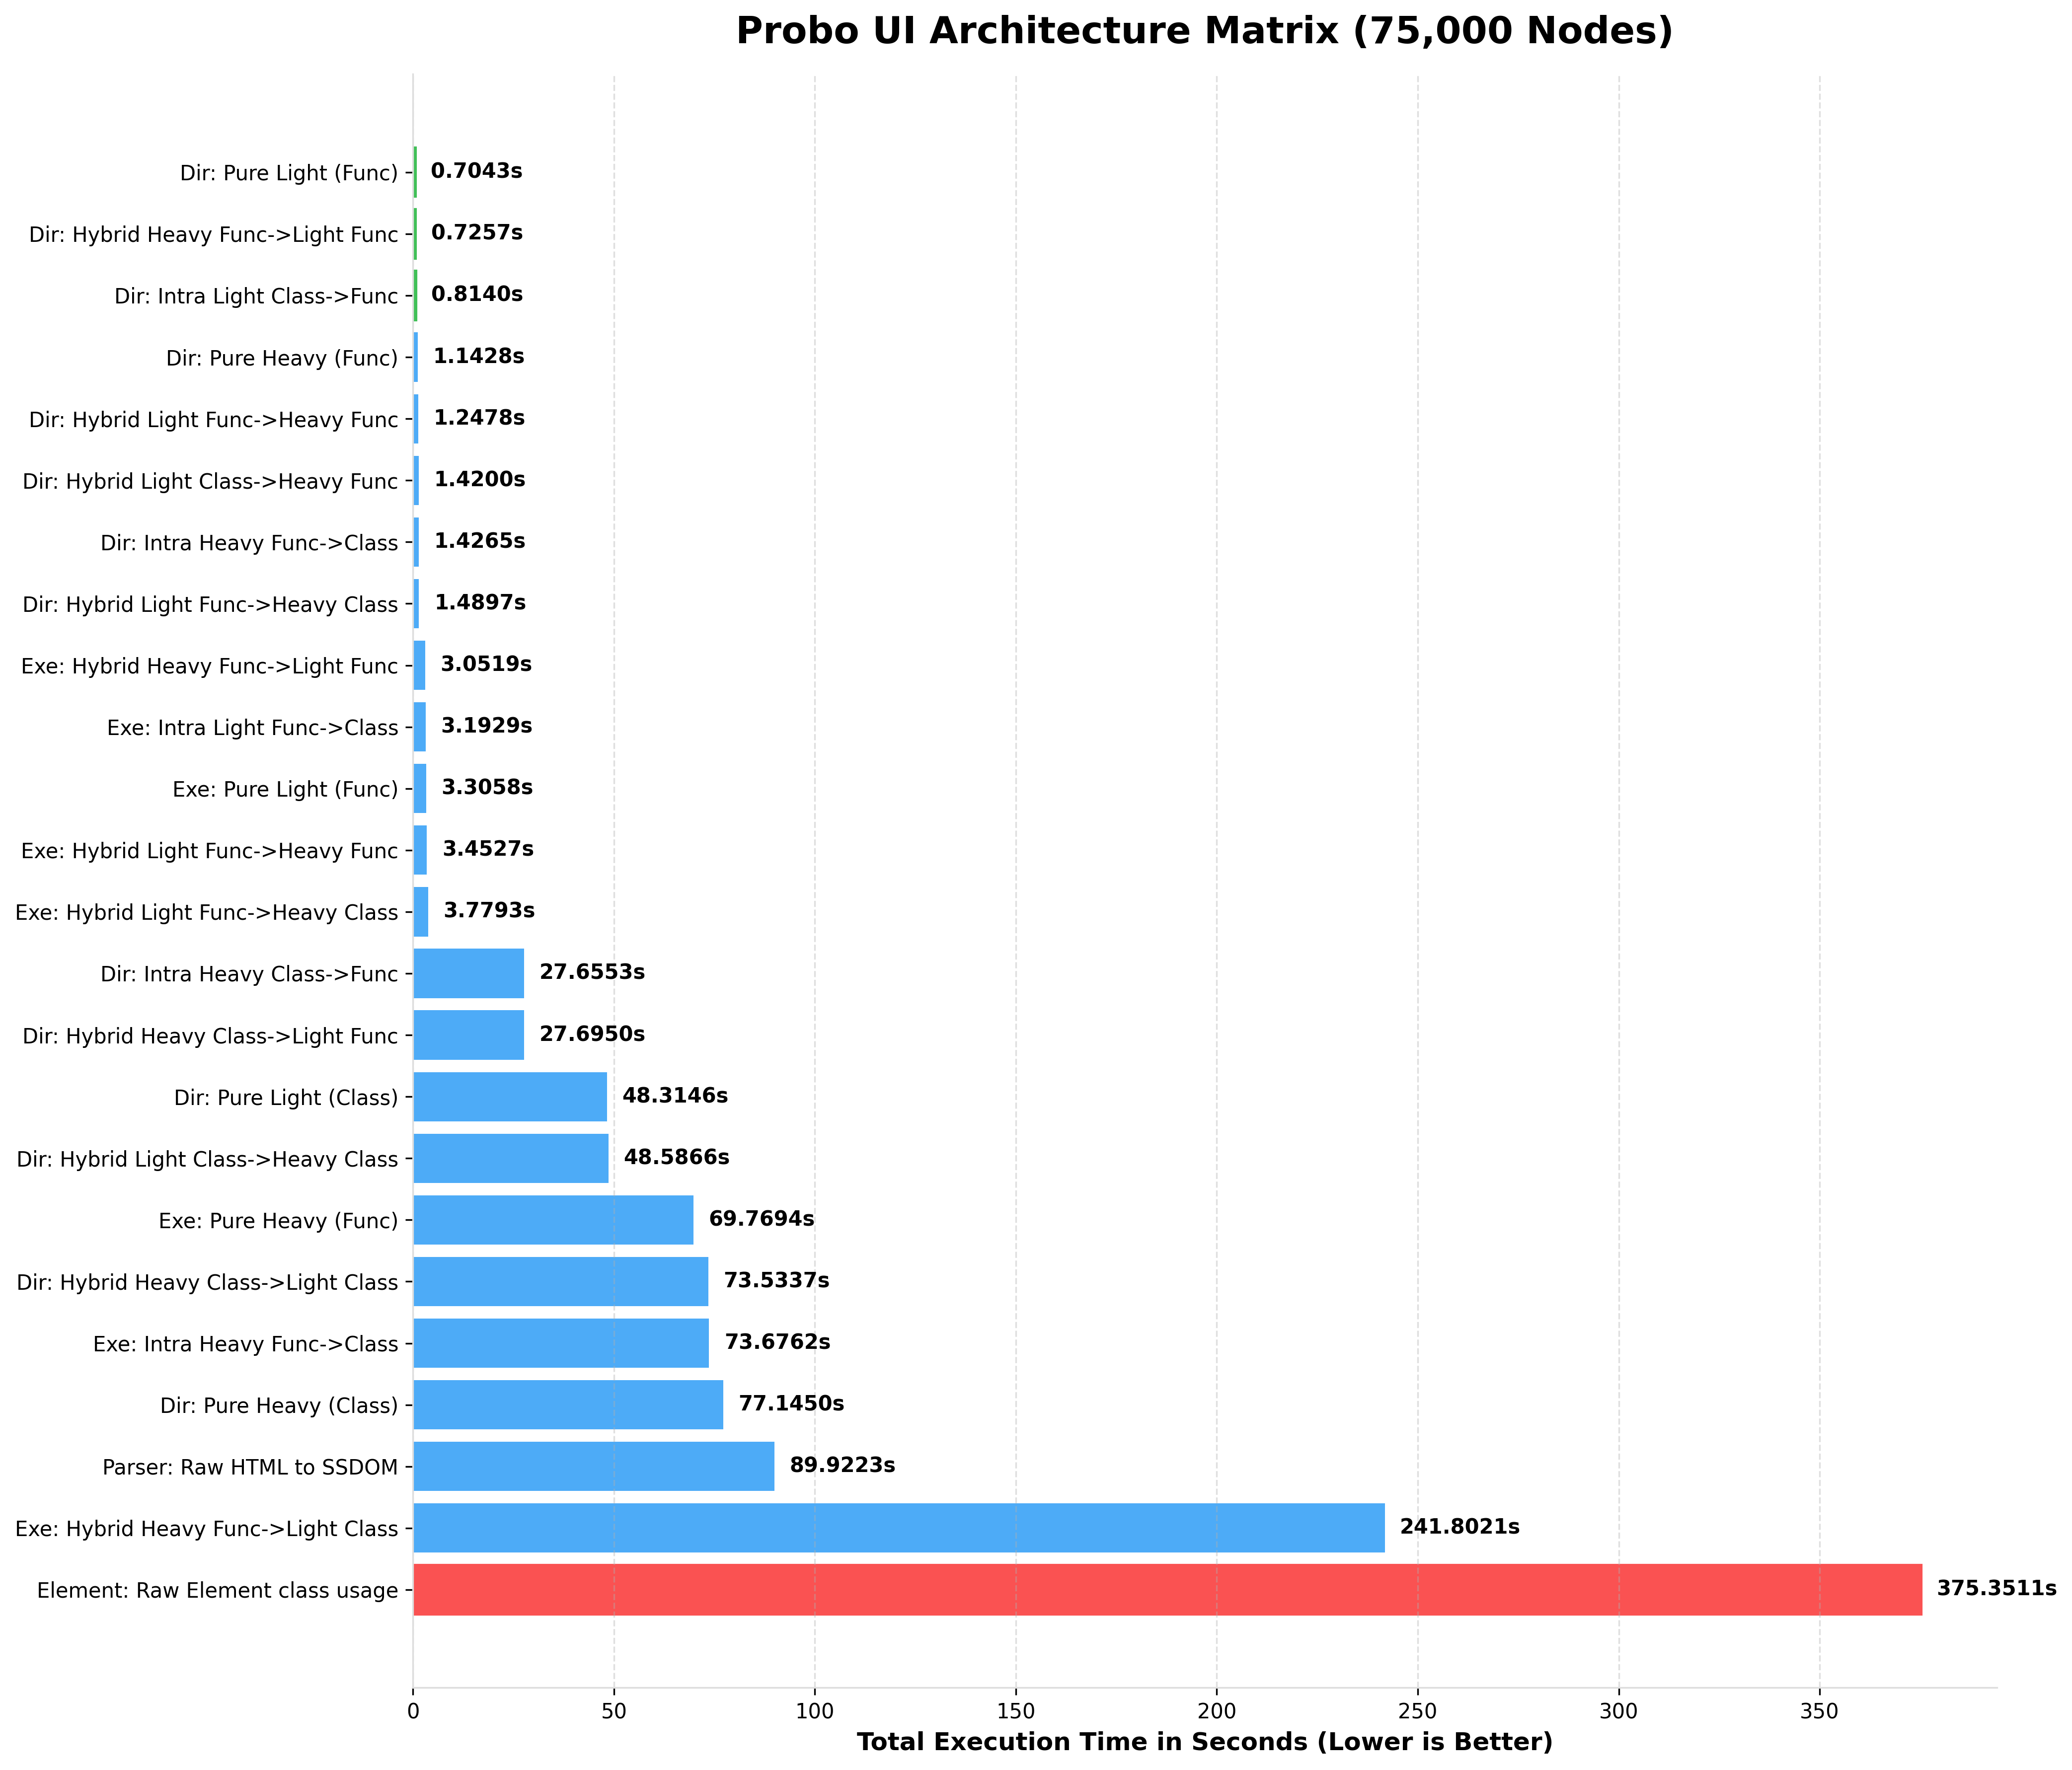
When looking at benchmarks of 75,000+ elements, it's easy to think you should only use Light Functional tags (l_div) for everything. You shouldn't.
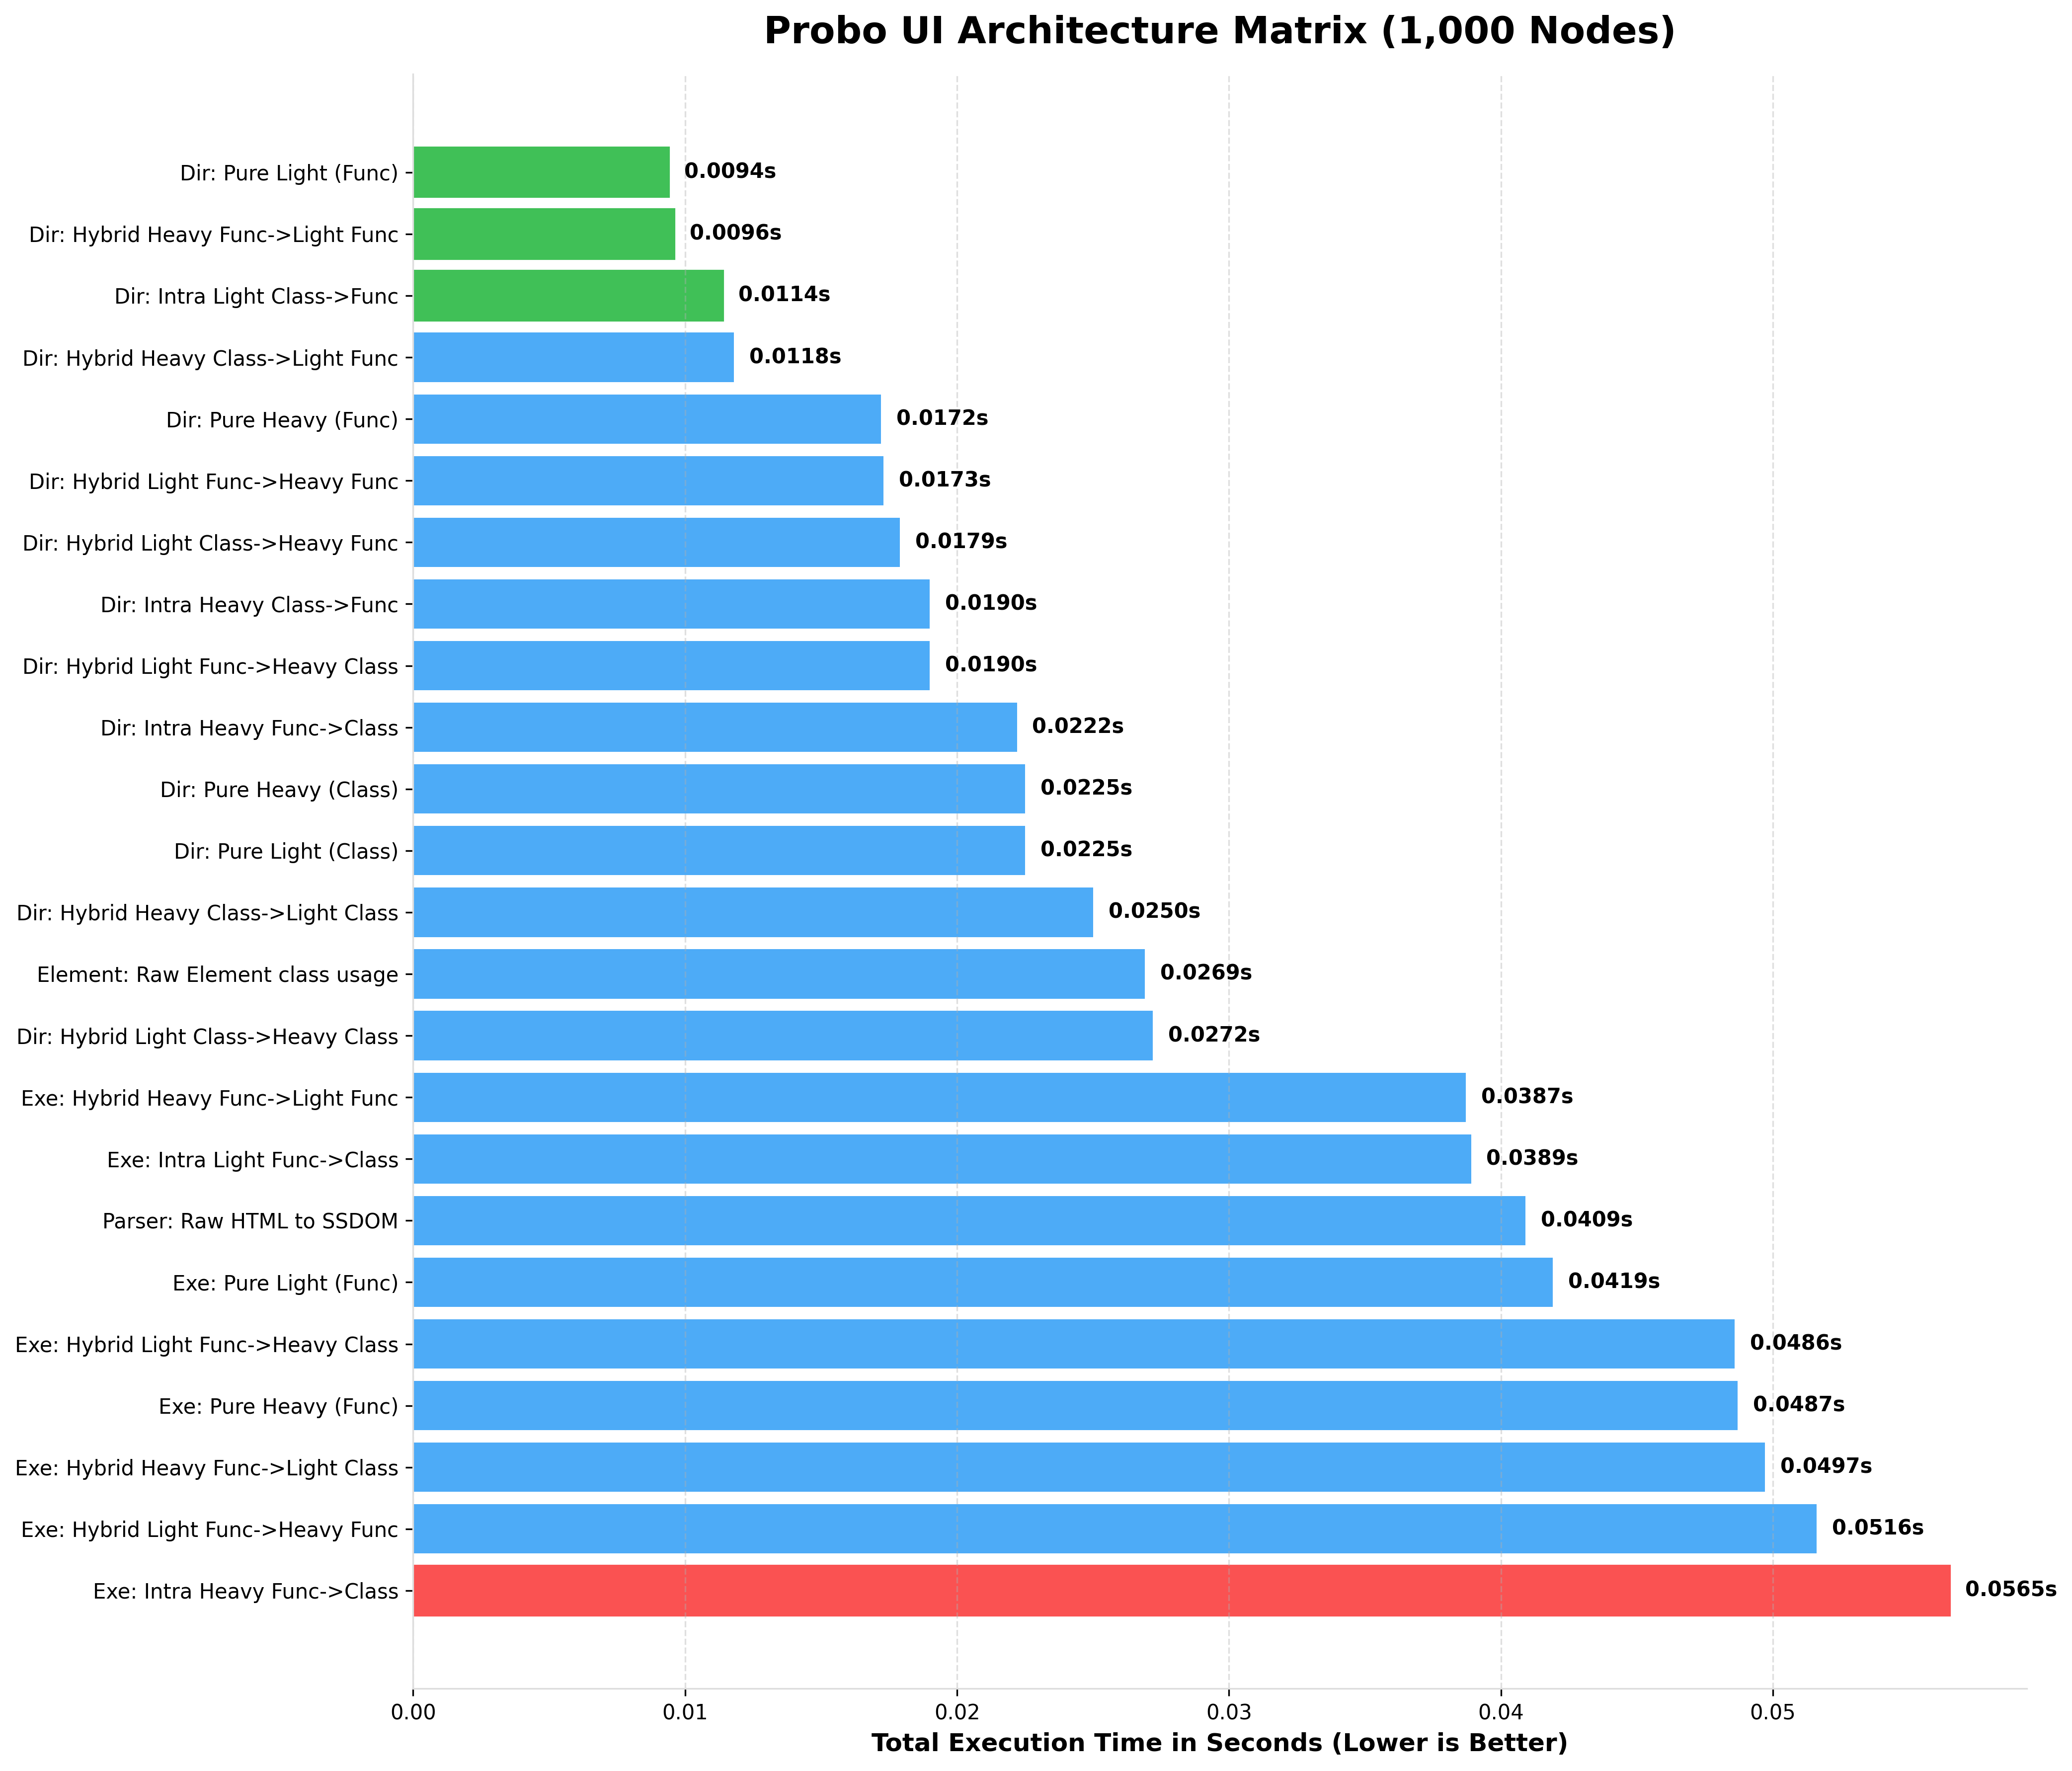
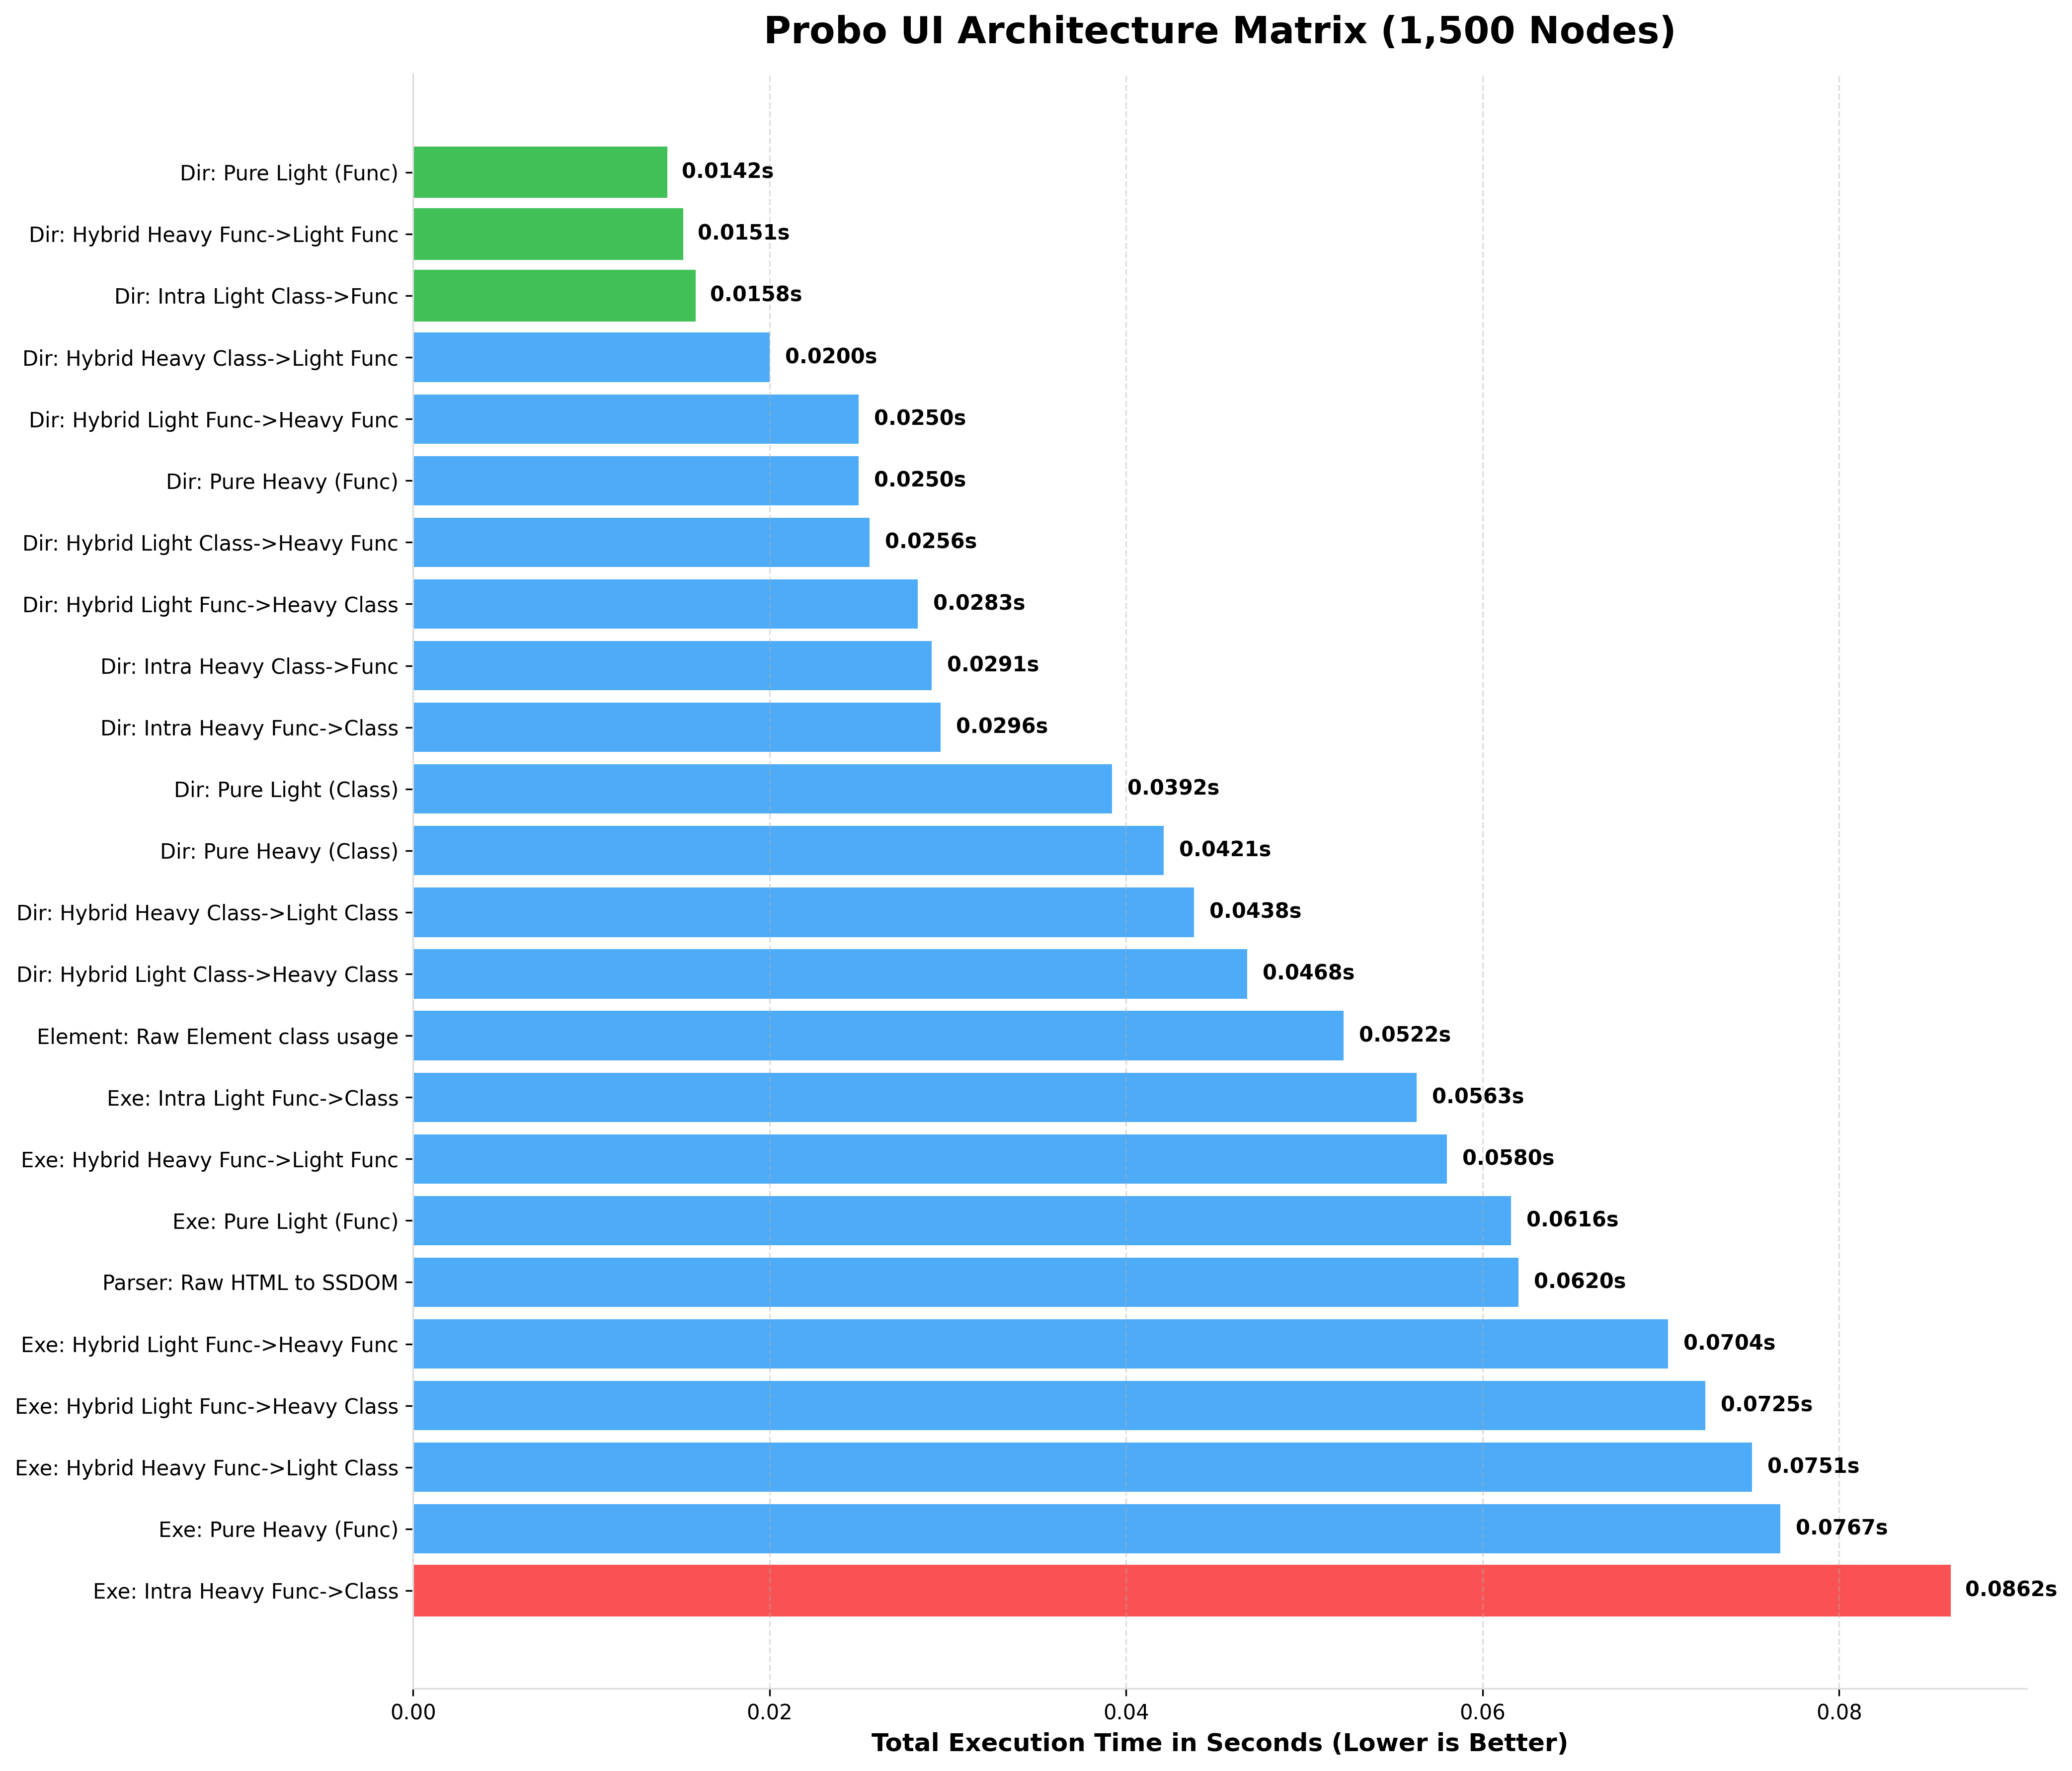
Google Lighthouse and Web Vitals strictly recommend keeping your total DOM size under 1,500 elements for optimal browser rendering.
At Google's recommended maximum of 1,500 nodes, Probo's absolute heaviest, most feature-rich architecture (Pure Heavy Class) evaluates in just ~0.04 seconds (40 milliseconds).
The Golden Rule: Use Light tags (l_div, Lspan, etc) as your standard default for any structure or content that does not require dynamic styling or attribute manipulation.
Reserve Heavy OOP classes (DIV, FORM, CARD) specifically for the wrappers and components where you actively need to use the style_manager, attr_manager, or SSDOM querying APIs.
By building the static bulk of your UI with Light tags and wrapping them in Heavy classes only when you need dynamic manipulation, you naturally create the perfectly optimized "Chimera" architecture! - ... And of course, you can do whatever you want! Probo UI is completely unopinionated. If you prefer writing your entire application in Pure Heavy OOP because you love the syntax, or if you want to write everything in Functional tags because you crave raw speed, Probo will never stop you. The framework is designed to adapt to your style, not the other way around.
The Methodology & Benchmark Script
To ensure complete accuracy, our benchmark suite runs each test in an isolated multiprocessing environment. This prevents Python's Garbage Collector (GC) and memory fragmentation from previous tests from skewing the results of subsequent tests.
You can reproduce these benchmarks on your own server using the official test script below.
run_benchmarks.py
import time
import gc
import inspect
import multiprocessing
import argparse
from typing import Any, Tuple

# --- Adjust these imports to your actual Probo paths ---
from probo import div, DIV
from probo.components.light_tags import l_div, Ldiv
from probo.components.elements import Element
from probo.components.executer import ProboFunctionalExecuter, tuplizer as _
from probo.templates.parser import ProboTemplateParser  # Assuming you have a parser function


def execute_render(node: Any, shared_EL: Element) -> str:
    if isinstance(node, str):
        return node
    if hasattr(node, "render"):
        sig = inspect.signature(node.render)
        if "EL" in sig.parameters:
            return node.render(shared_EL)
        else:
            return node.render()
    return str(node)


def isolated_benchmark_worker(
    name: str, mode: str, Root: Any, Child: Any, node_count: int, return_dict: dict
):
    """
    Runs a single benchmark inside an isolated process.
    Prevents memory leaks and OOM crashes for 1,000,000+ node tests.
    """
    # Disable automatic GC during the timed run to measure pure execution speed
    gc.disable()
    shared_EL = Element(is_list=True, use_deque=True)

    try:
        if mode == "standard":
            # 1. INITIALIZATION: DIRECT OOP / FUNCTIONAL
            t0 = time.perf_counter()
            sig = inspect.signature(Child)
            children = []
            for i in range(node_count):
                if "EL" in sig.parameters:
                    child = Child(shared_EL, f"Item {i}", id=f"c{i}")
                elif "return_list" in sig.parameters:
                    child = Child(
                        f"Item {i}", return_list=True, return_deque=True, id=f"c{i}"
                    )
                else:
                    child = Child(f"Item {i}", id=f"c{i}")
                children.append(child)

            root_sig = inspect.signature(Root)
            if "EL" in root_sig.parameters:
                page = Root(shared_EL, Root(shared_EL, *children, id="body"), id="html")
            elif "return_list" in root_sig.parameters:
                body = Root(*children, return_list=True, return_deque=True, id="body")
                page = Root(body, return_list=True, return_deque=True, id="html")
            else:
                body = Root(*children, id="body")
                page = Root(body, id="html")
            t1 = time.perf_counter()

            # 2. RENDER
            t2 = time.perf_counter()
            _res = execute_render(page, shared_EL)
            t3 = time.perf_counter()

        elif mode == "bare-element":
            t0 = time.perf_counter()
            rEL = Element(is_list=True,collect_history=True)

            for i in range(node_count):
                rEL.div(f"Item {i}", id=f"c{i}")

            page = rEL.div(Id="body").element
            t1 = time.perf_counter()

            # 2. RENDER
            t2 = time.perf_counter()
            _res = execute_render(page, shared_EL)
            t3 = time.perf_counter()

        elif mode == "executer":
            # 1. INITIALIZATION: EXECUTER DSL
            t0 = time.perf_counter()
            exe = ProboFunctionalExecuter(Root, id="html").include_dependency(
                EL=shared_EL
            )
            exe /= _("root", "body", Root, id="body")

            for i in range(node_count):
                exe /= _("root.body", Child, f"Item {i}", id=f"c{i}")

            page = exe.execute()
            t1 = time.perf_counter()

            # 2. RENDER
            t2 = time.perf_counter()
            _res = execute_render(page, shared_EL)
            t3 = time.perf_counter()

        elif mode == "parser":
            # 1. INITIALIZATION: STRING COMPILATION -> PARSER
            # We don't count the python string generation time, just the parsing time.
            html_string = f"<div id='html'><div id='body'>{''.join([f'<div id=\"c{i}\">Item {i}</div>' for i in range(node_count)])}</div></div>"

            t0 = time.perf_counter()
            parser = ProboTemplateParser()
            page = parser.parse(html_string,mode='heavy')
            t1 = time.perf_counter()

            # 2. RENDER
            t2 = time.perf_counter()
            _res = execute_render(page, shared_EL)
            t3 = time.perf_counter()

        else:
            raise ValueError(f"Unknown mode: {mode}")

        init_time = t1 - t0
        rend_time = t3 - t2
        return_dict["result"] = (name, init_time, rend_time, init_time + rend_time)

    except Exception as e:
        return_dict["result"] = (name, -1.0, -1.0, -1.0)
        with open('error.txt','w') as f:
            f.writelines(str(e))

    finally:
        gc.enable()


def run_isolated(
    name, mode, Root, Child, node_count
) -> Tuple[str, float, float, float]:
    manager = multiprocessing.Manager()
    return_dict = manager.dict()

    p = multiprocessing.Process(
        target=isolated_benchmark_worker,
        args=(name, mode, Root, Child, node_count, return_dict),
    )
    p.start()
    p.join()  # Wait for the process to completely finish and clear memory
    return return_dict.get("result", (name, -1.0, -1.0, -1.0))


# ======================================================================
# DEFINING THE COMBINATIONS MATRIX
# ======================================================================

STANDARD_MATRIX = [
    # --- PURE ARCHITECTURES ---
    ("Dir: Pure Heavy (Class)", "standard", DIV, DIV),
    ("Dir: Pure Heavy (Func)", "standard", div, div),
    ("Dir: Pure Light (Class)", "standard", Ldiv, Ldiv),
    ("Dir: Pure Light (Func)", "standard", l_div, l_div),
    # --- INTRA-TIER HYBRIDS ---
    ("Dir: Intra Heavy Class->Func", "standard", DIV, div),
    ("Dir: Intra Heavy Func->Class", "standard", div, DIV),
    ("Dir: Intra Light Class->Func", "standard", Ldiv, l_div),
    # --- CROSS-TIER HYBRIDS ---
    ("Dir: Hybrid Heavy Class->Light Class", "standard", DIV, Ldiv),
    ("Dir: Hybrid Heavy Class->Light Func", "standard", DIV, l_div),
    ("Dir: Hybrid Heavy Func->Light Func", "standard", div, l_div),
    ("Dir: Hybrid Light Class->Heavy Class", "standard", Ldiv, DIV),
    ("Dir: Hybrid Light Class->Heavy Func", "standard", Ldiv, div),
    ("Dir: Hybrid Light Func->Heavy Class", "standard", l_div, DIV),
    ("Dir: Hybrid Light Func->Heavy Func", "standard", l_div, div),
]

EXECUTER_MATRIX = [
    ("Exe: Pure Heavy (Func)", "executer", div, div),
    ("Exe: Pure Light (Func)", "executer", l_div, l_div),
    ("Exe: Intra Heavy Func->Class", "executer", div, DIV),
    ("Exe: Intra Light Func->Class", "executer", l_div, Ldiv),
    ("Exe: Hybrid Heavy Func->Light Class", "executer", div, Ldiv),
    ("Exe: Hybrid Heavy Func->Light Func", "executer", div, l_div),
    ("Exe: Hybrid Light Func->Heavy Class", "executer", l_div, DIV),
    ("Exe: Hybrid Light Func->Heavy Func", "executer", l_div, div),
]

PARSER_MATRIX = [("Parser: Raw HTML to SSDOM", "parser", None, None)]
RAW_ELEMNET = [("Element: Raw Element class usage", "bare-element", None, None)]

ALL_BENCHMARKS = STANDARD_MATRIX + EXECUTER_MATRIX + PARSER_MATRIX + RAW_ELEMNET

# ======================================================================
# EXECUTION SCRIPT
# ======================================================================

if __name__ == "__main__":
    # Allows you to run `python run_benchmarks.py --count 1000000` via CLI
    parser = argparse.ArgumentParser(description="Probo Ultimate Performance Matrix")
    parser.add_argument(
        "--counts",
        nargs="+",
        type=int,
        default=[
            100,
            1_000,
            1_500,
            2_000,
            2_500,
            5_000,
            7_500,
            10_000,
            15_000,
            20_000,
            25_000,
            50_000,
            75_000,
        ],
        help="List of node counts to benchmark",
    )
    args = parser.parse_args()

    print("=" * 105)
    print(" PROBO v1.3.4 : THE GRAND HYBRID MATRIX BENCHMARK (ISOLATED PROCESSES) ")
    print("=" * 105)

    for count in args.counts:
        print(f"\n## BENCHMARKING {count:,} NODES  --- ]")
        print(
            f"{'Architecture (Root -> Child)':<45} | {'Init Time':>10} | {'Rend Time':>10} | {'Total Time':>10} | {'vs Worst'}"
        )
        print("-" * 105)

        results = []
        for name, mode, Root, Child in ALL_BENCHMARKS:
            res = run_isolated(name, mode, Root, Child, count)
            results.append(res)

        # Sort by fastest total time
        results.sort(key=lambda x: x[3] if x[3] >= 0 else float("inf"))

        # Calculate speedup relative to the SLOWEST successful run
        worst_total = max((r[3] for r in results if r[3] > 0), default=0.0001)

        for name, init_t, rend_t, total_t in results:
            if total_t == -1:
                print(
                    f"{name:<45} | {'ERROR':>10} | {'ERROR':>10} | {'ERROR':>10} | N/A"
                )
            else:
                speedup = worst_total / total_t
                print(
                    f"{name:<45} | {init_t:>9.4f}s | {rend_t:>9.4f}s | {total_t:>9.4f}s | {speedup:>6.2f}x"
                )
- to run test:
- save the test into performance.py.
- type:
python performance.py --counts 100. (or any number)
2. Console Output (100 up to 75k Nodes)
Here is the actual terminal output generated by the benchmark script when simulating a massive UI tree.
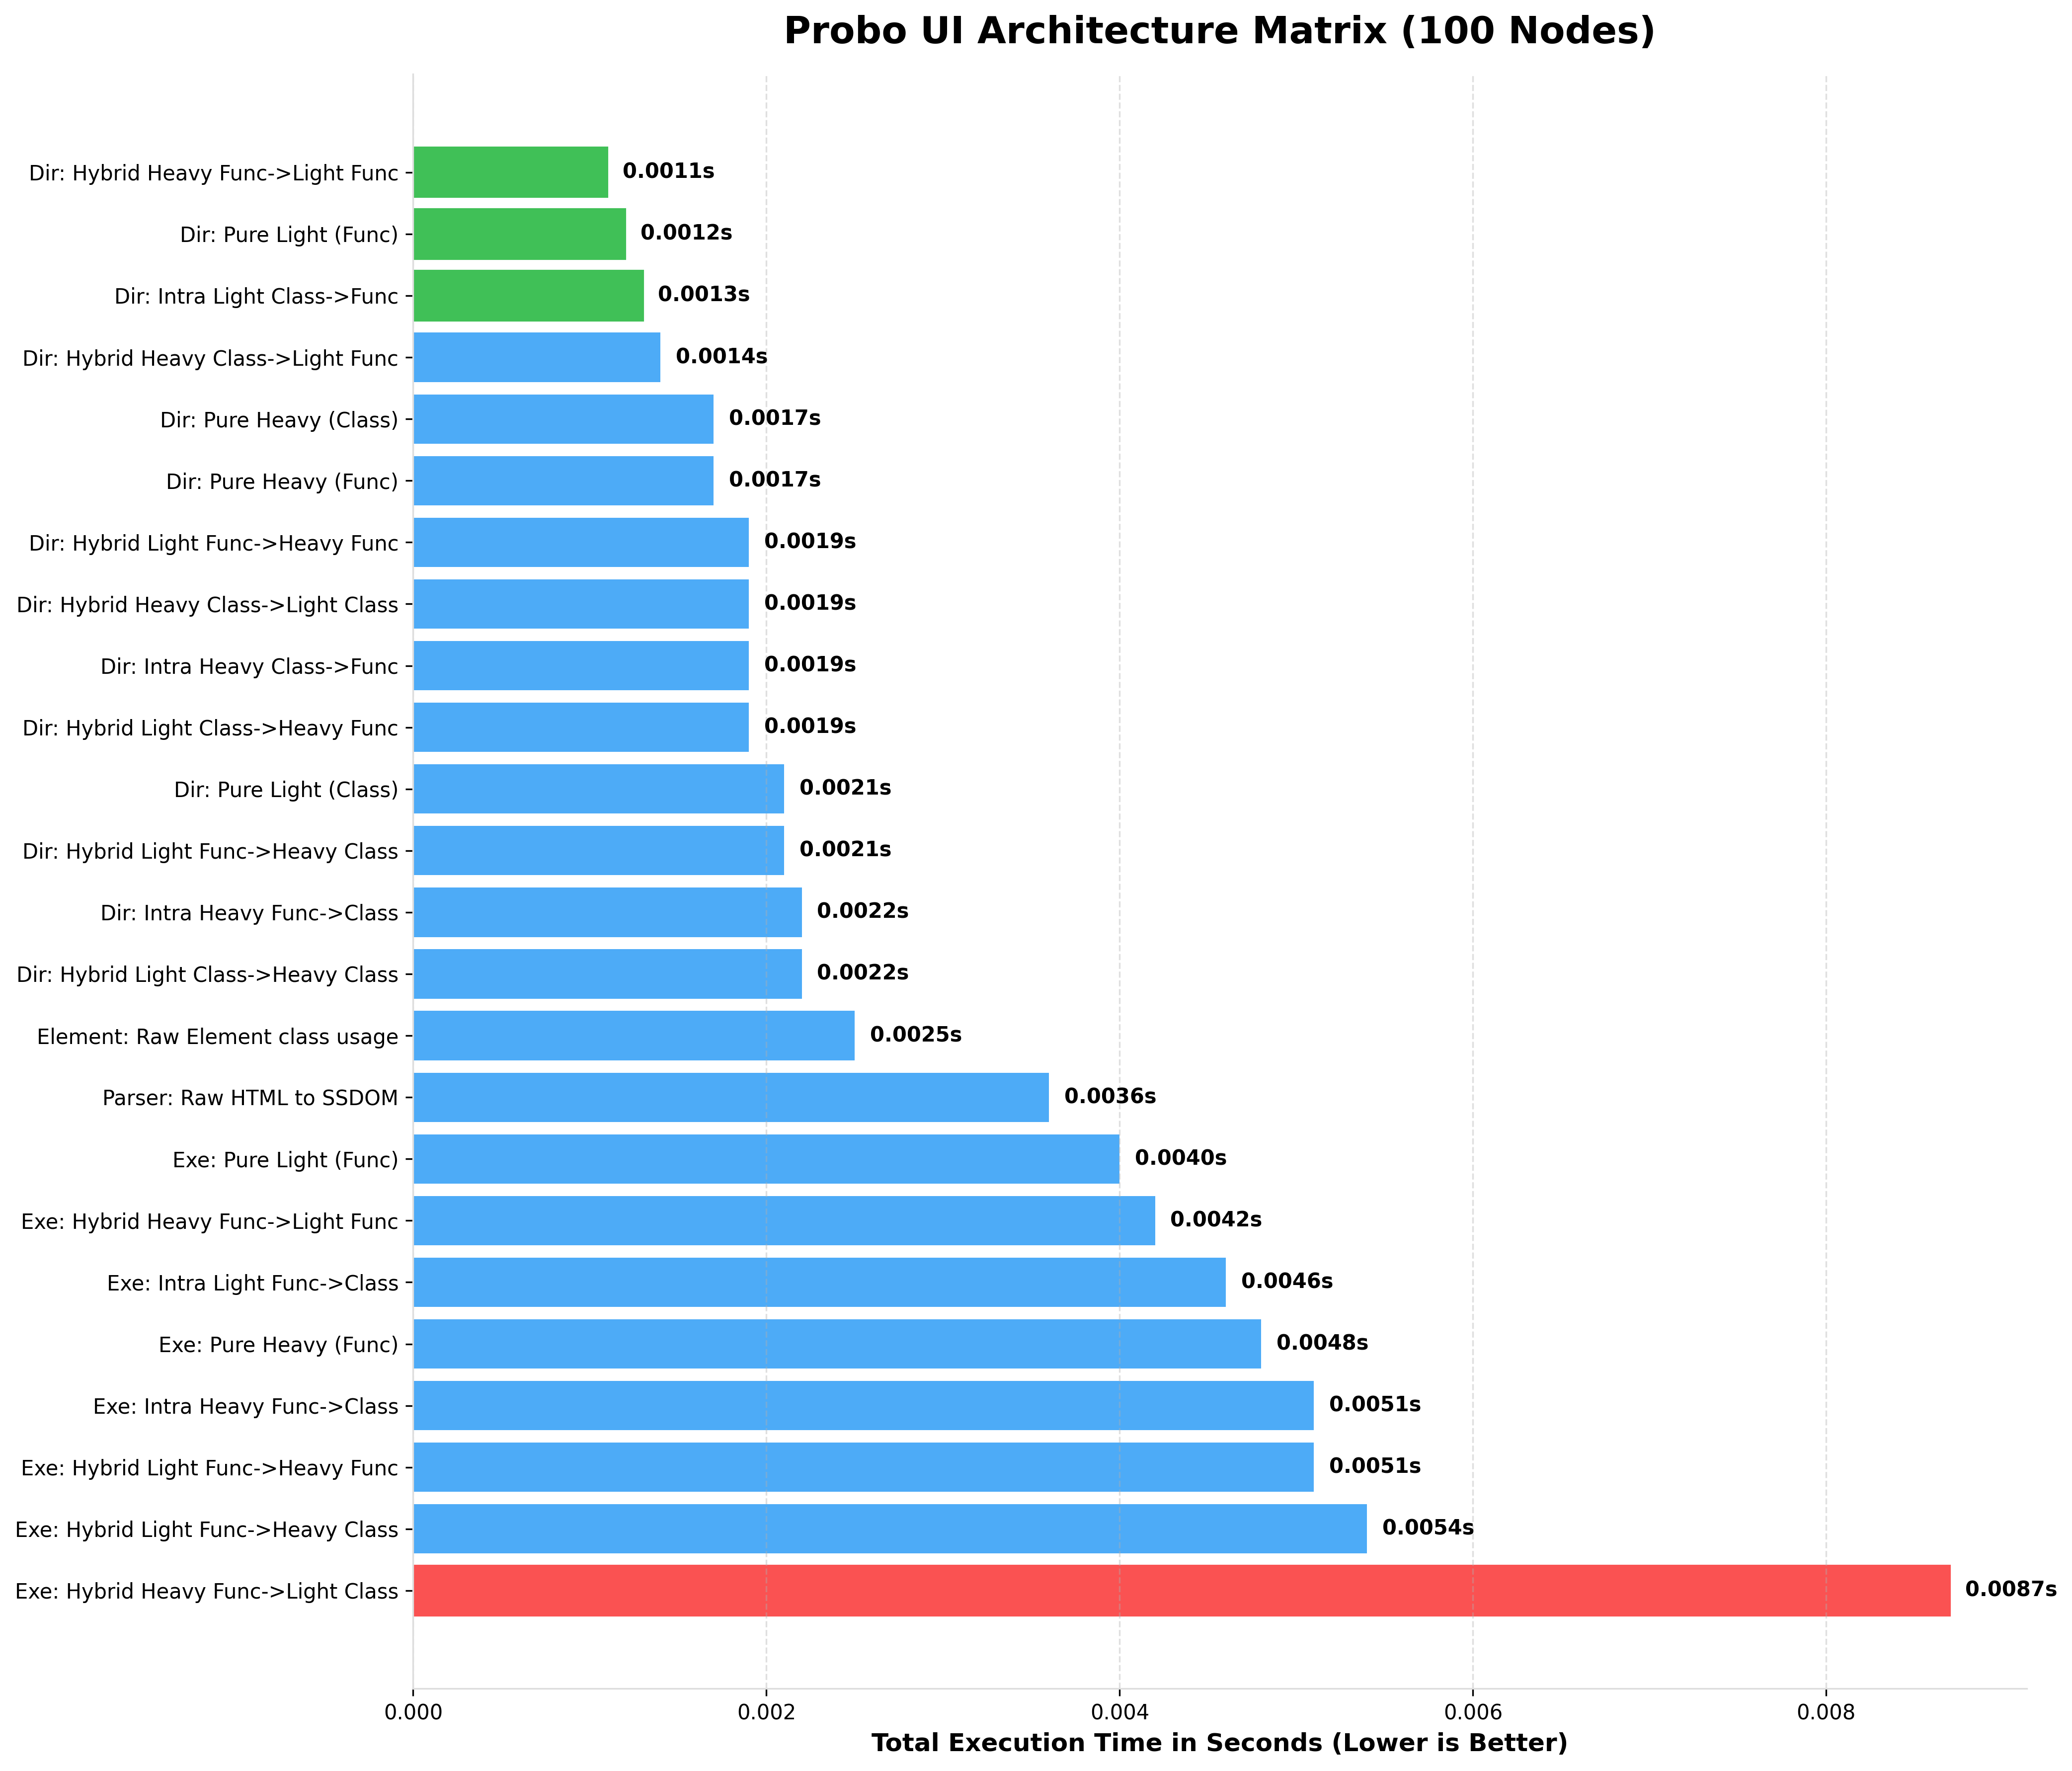
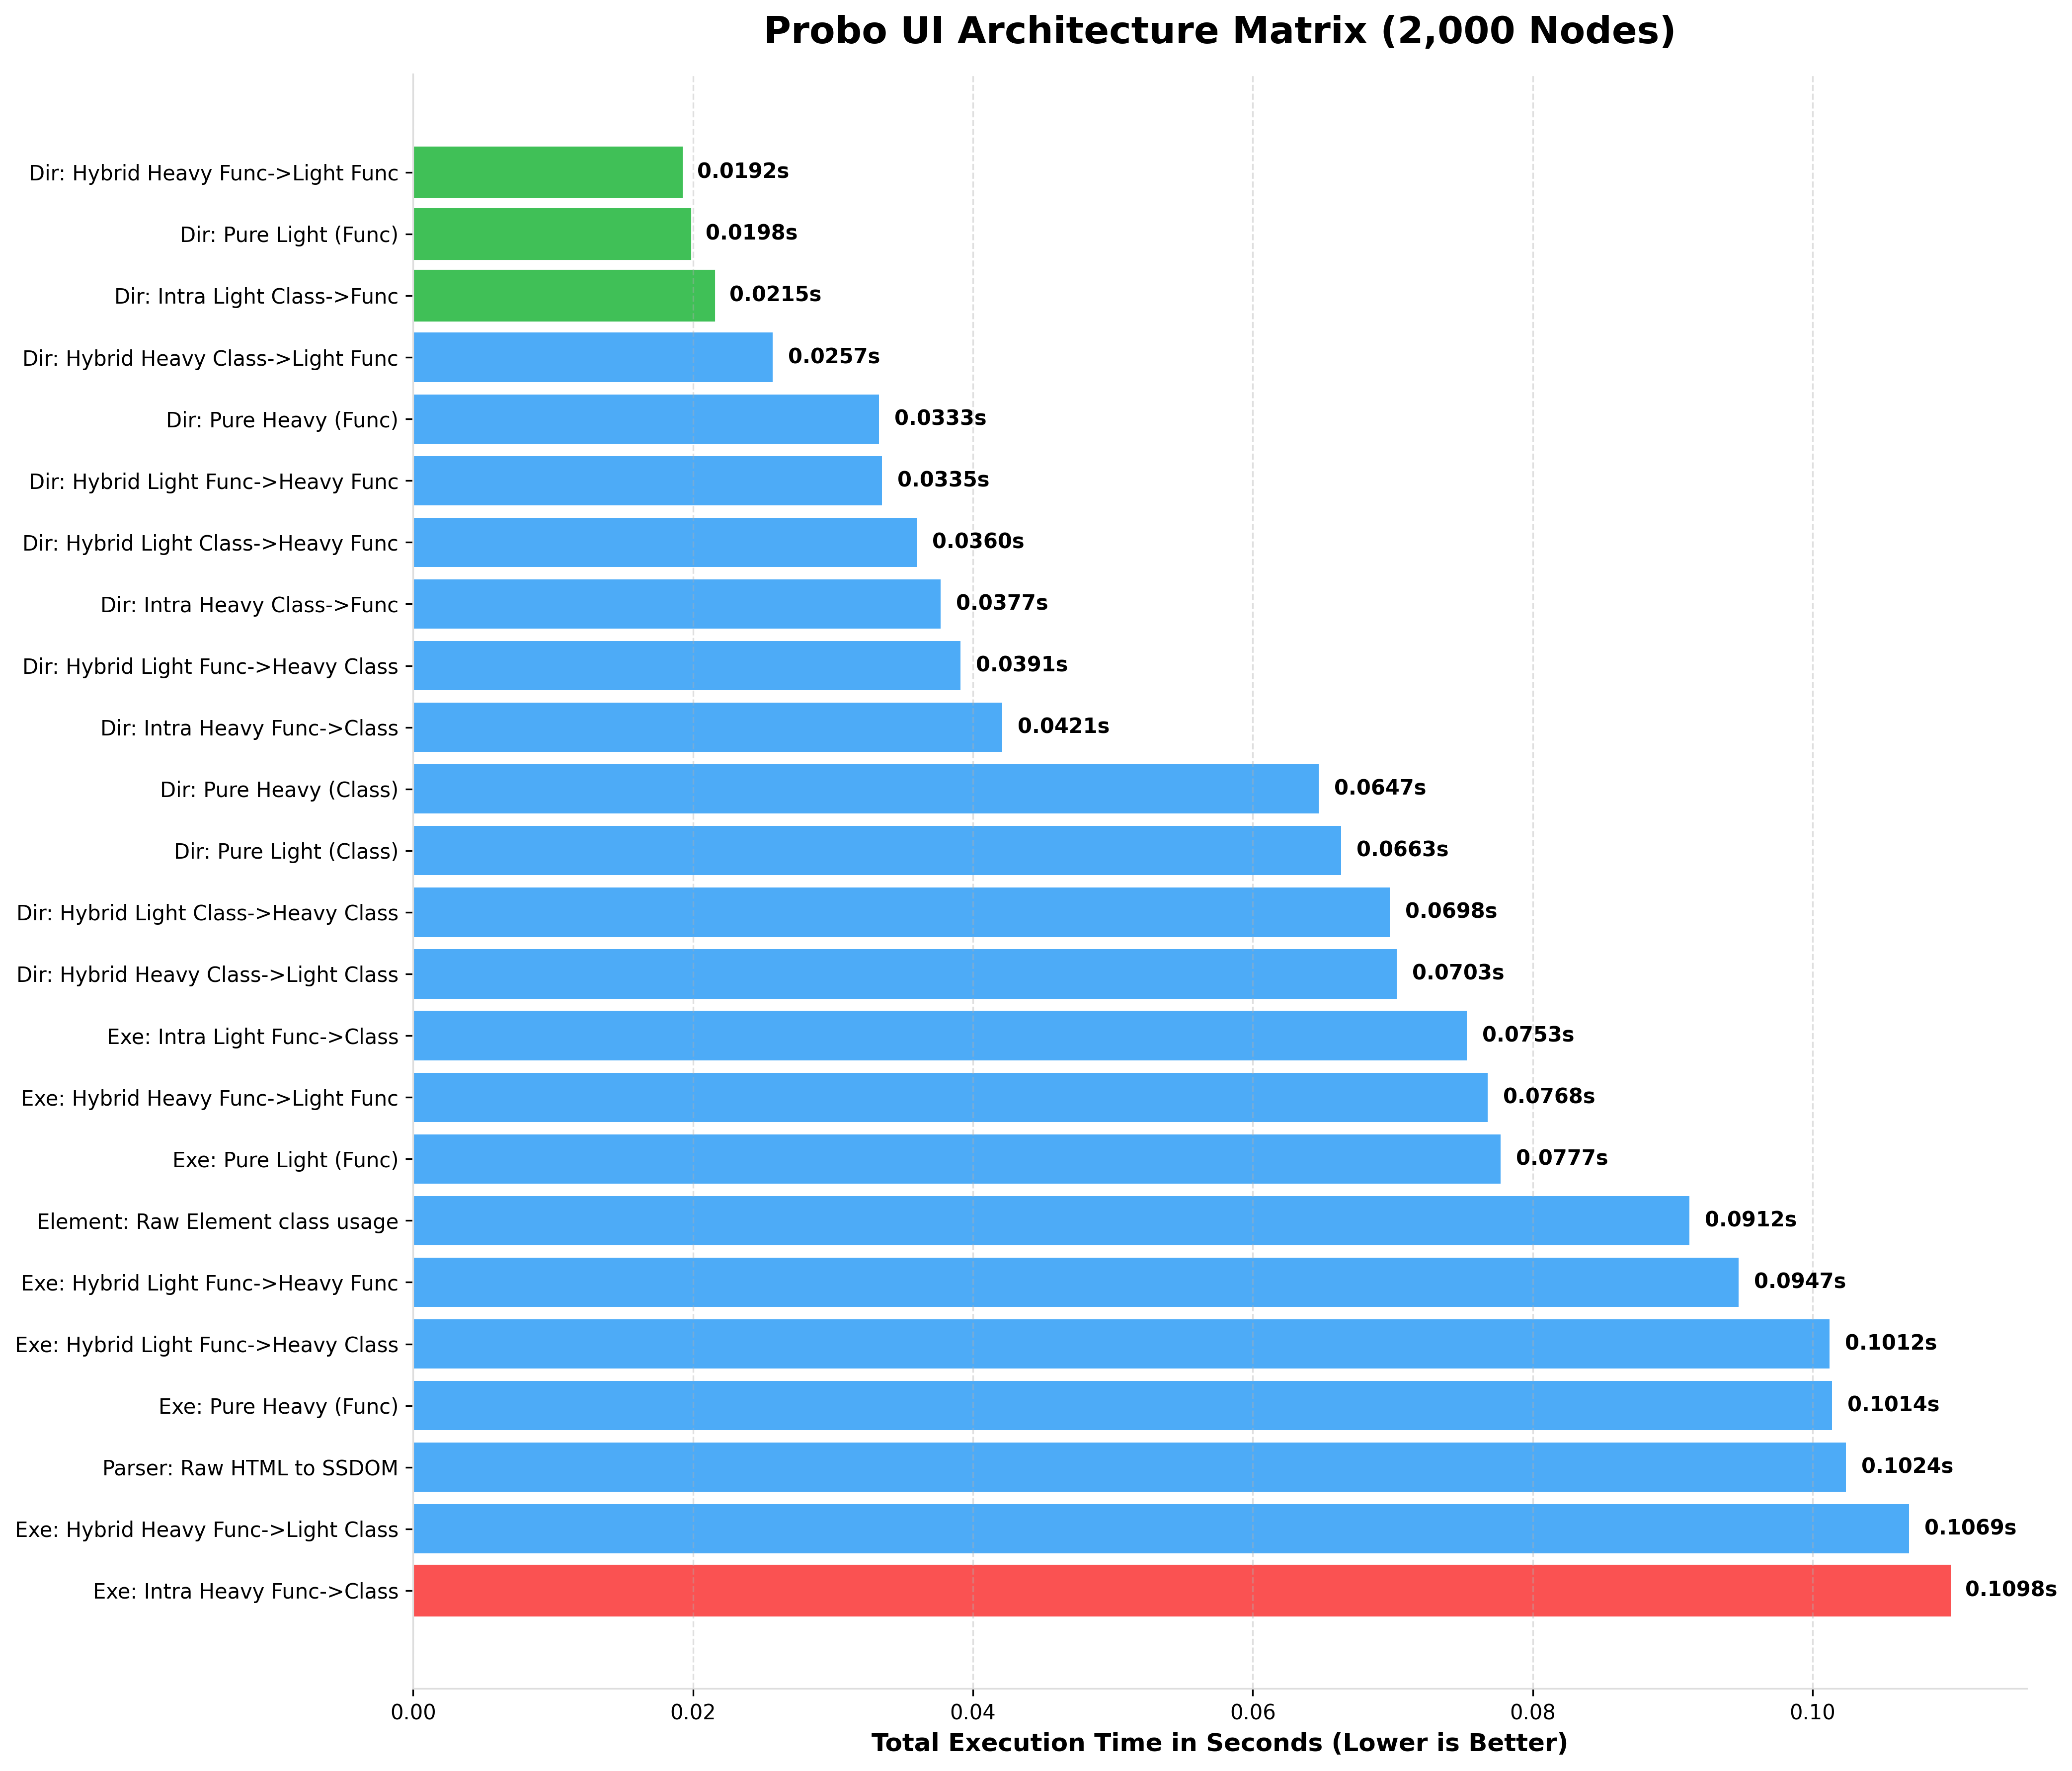
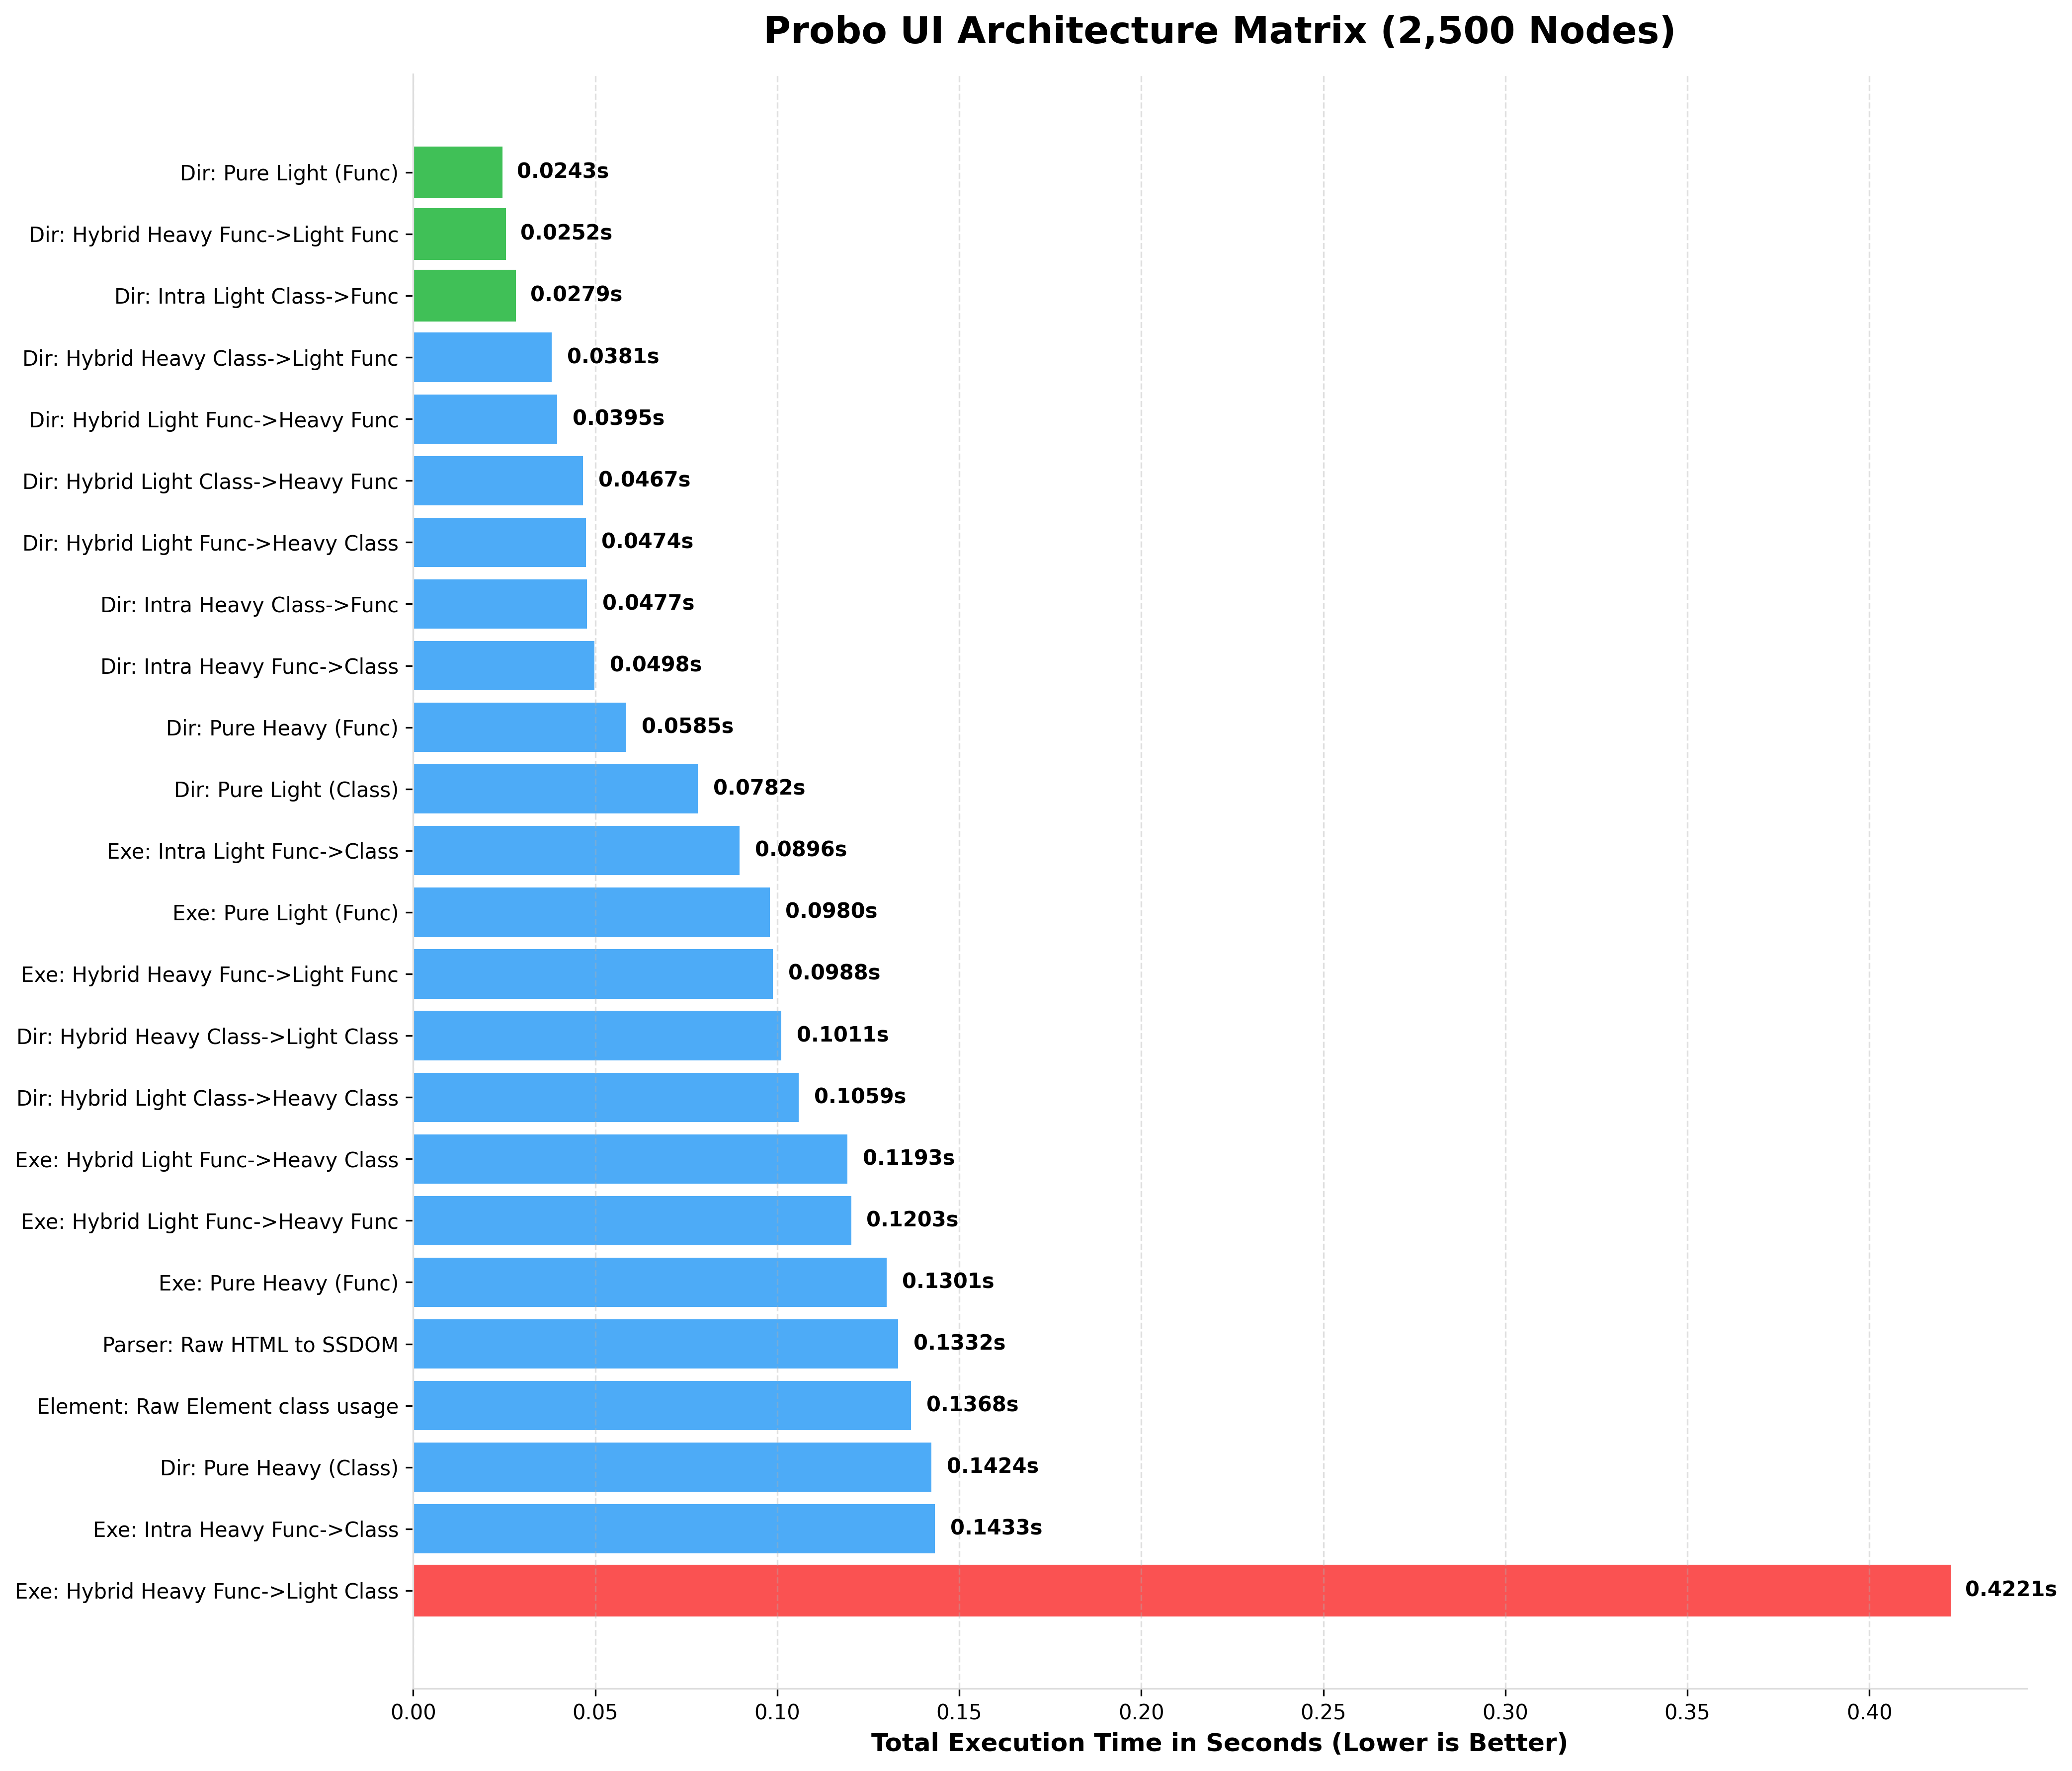
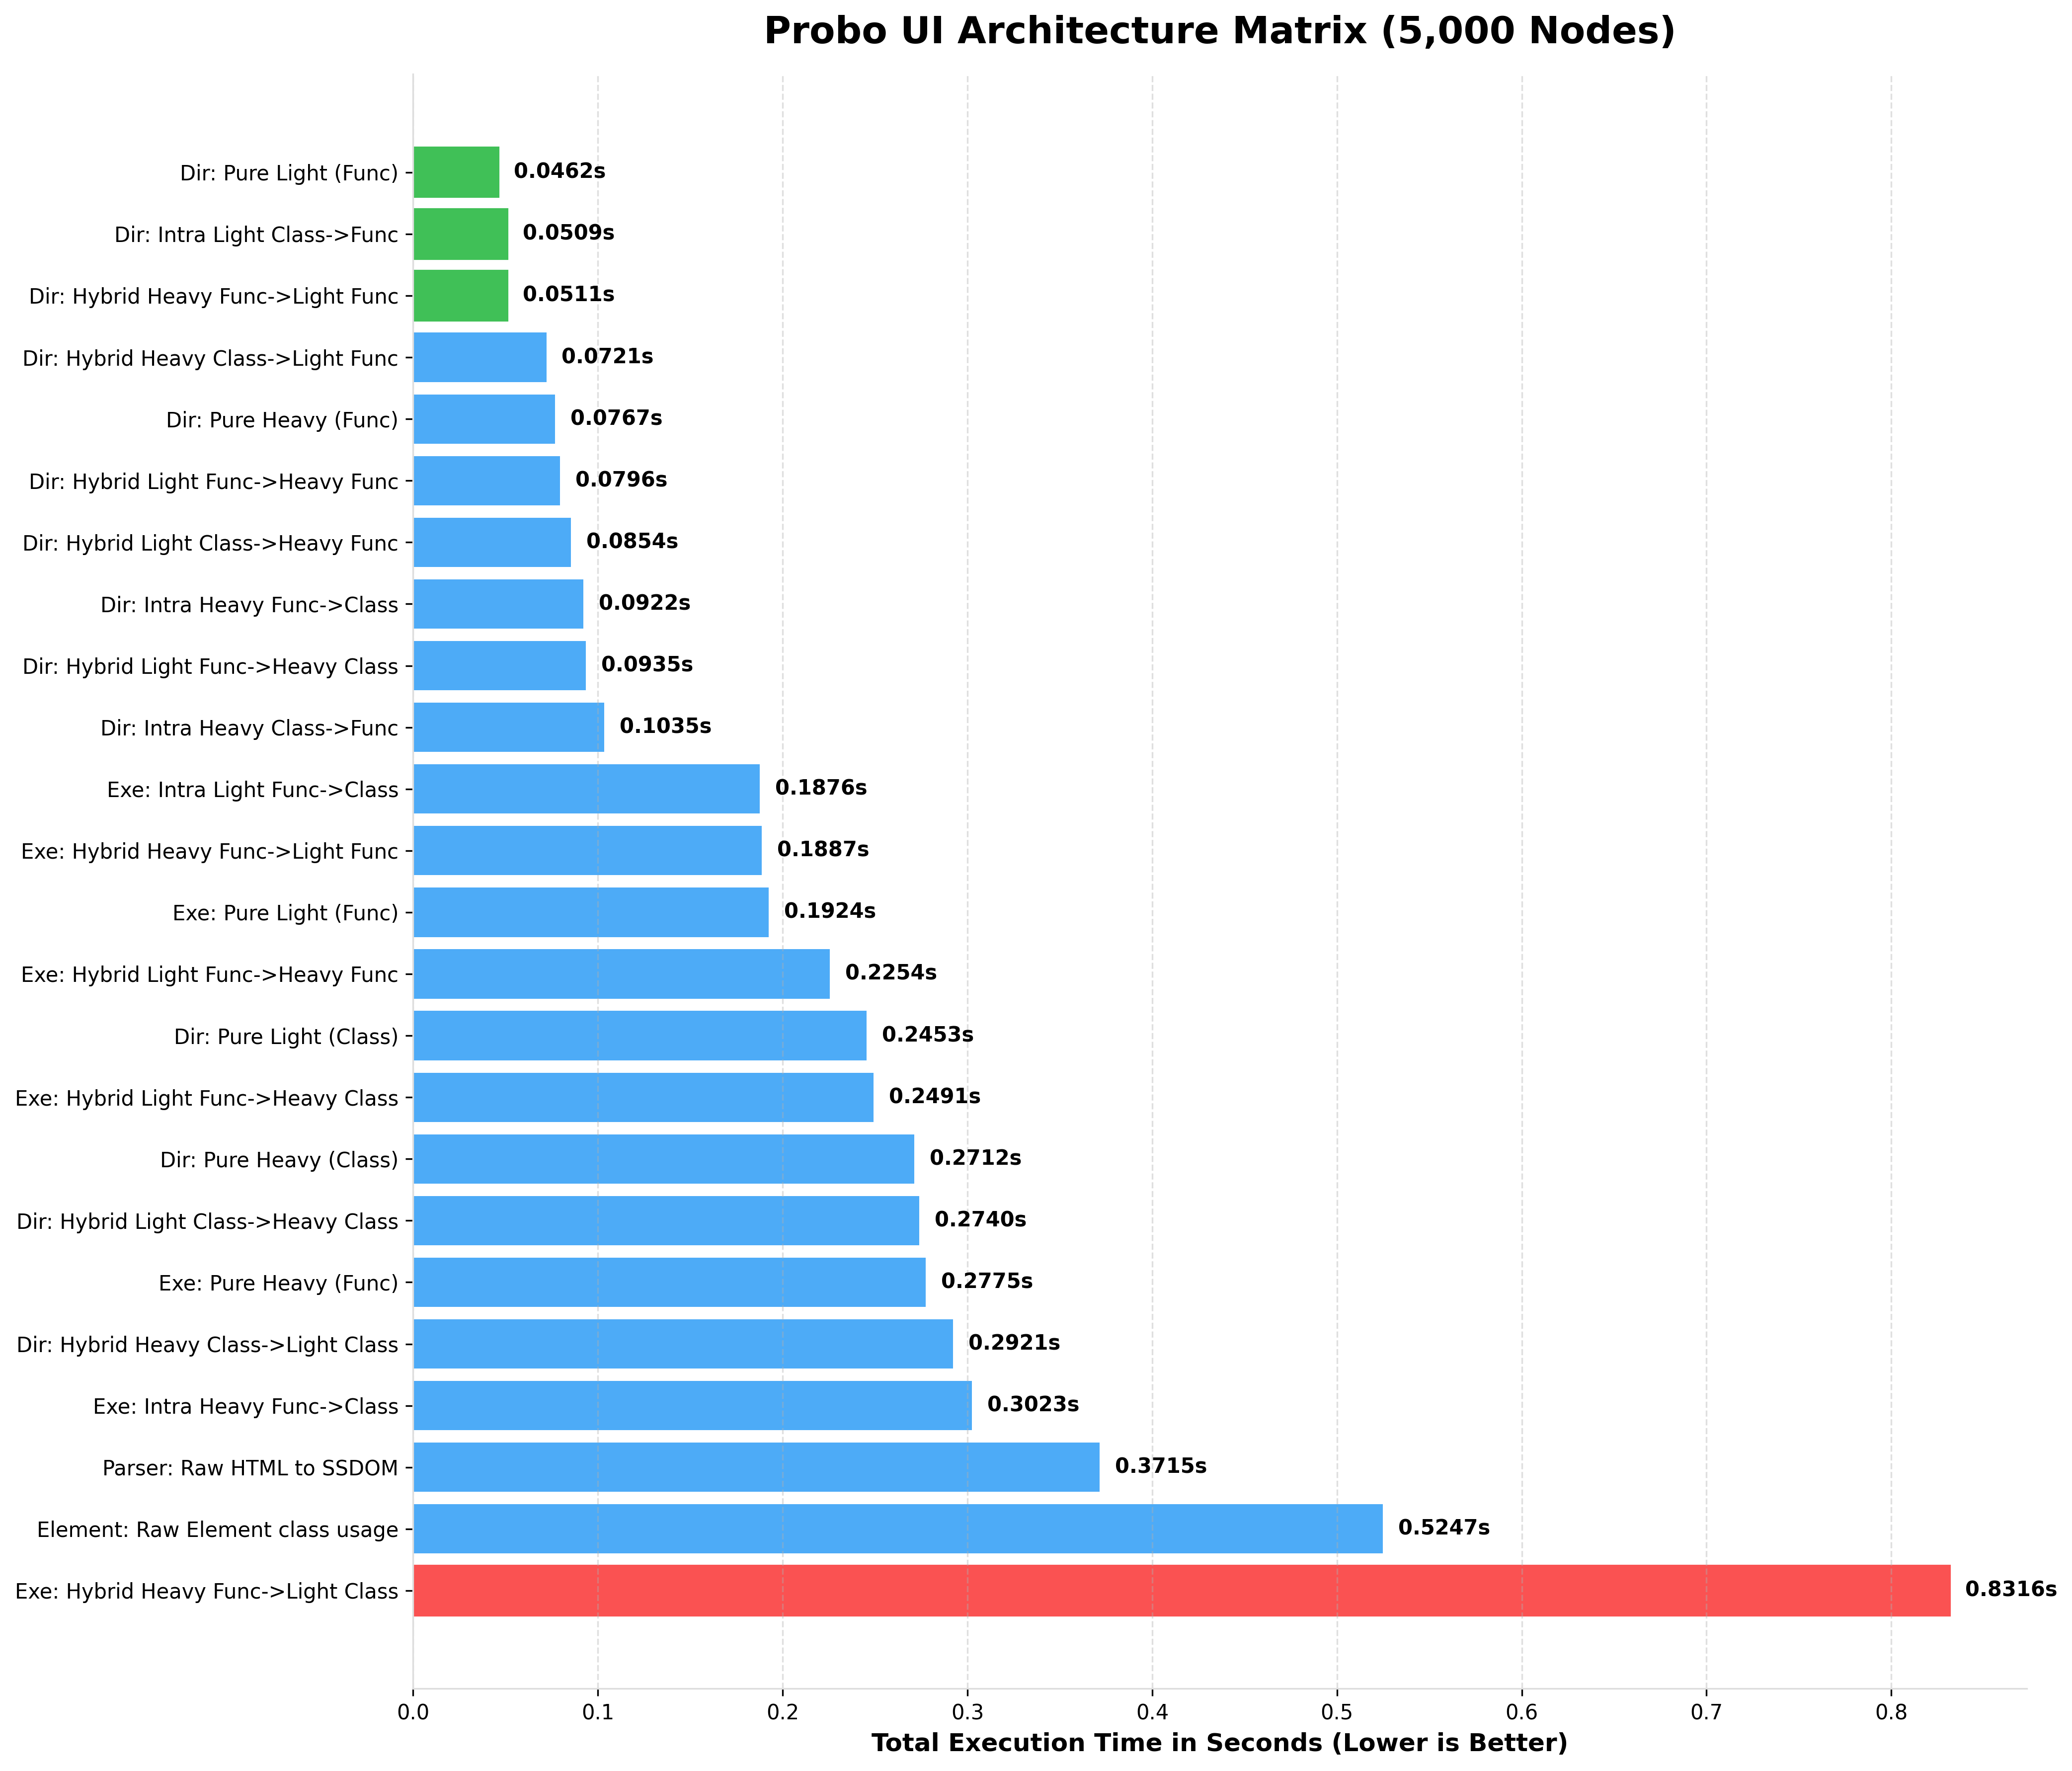
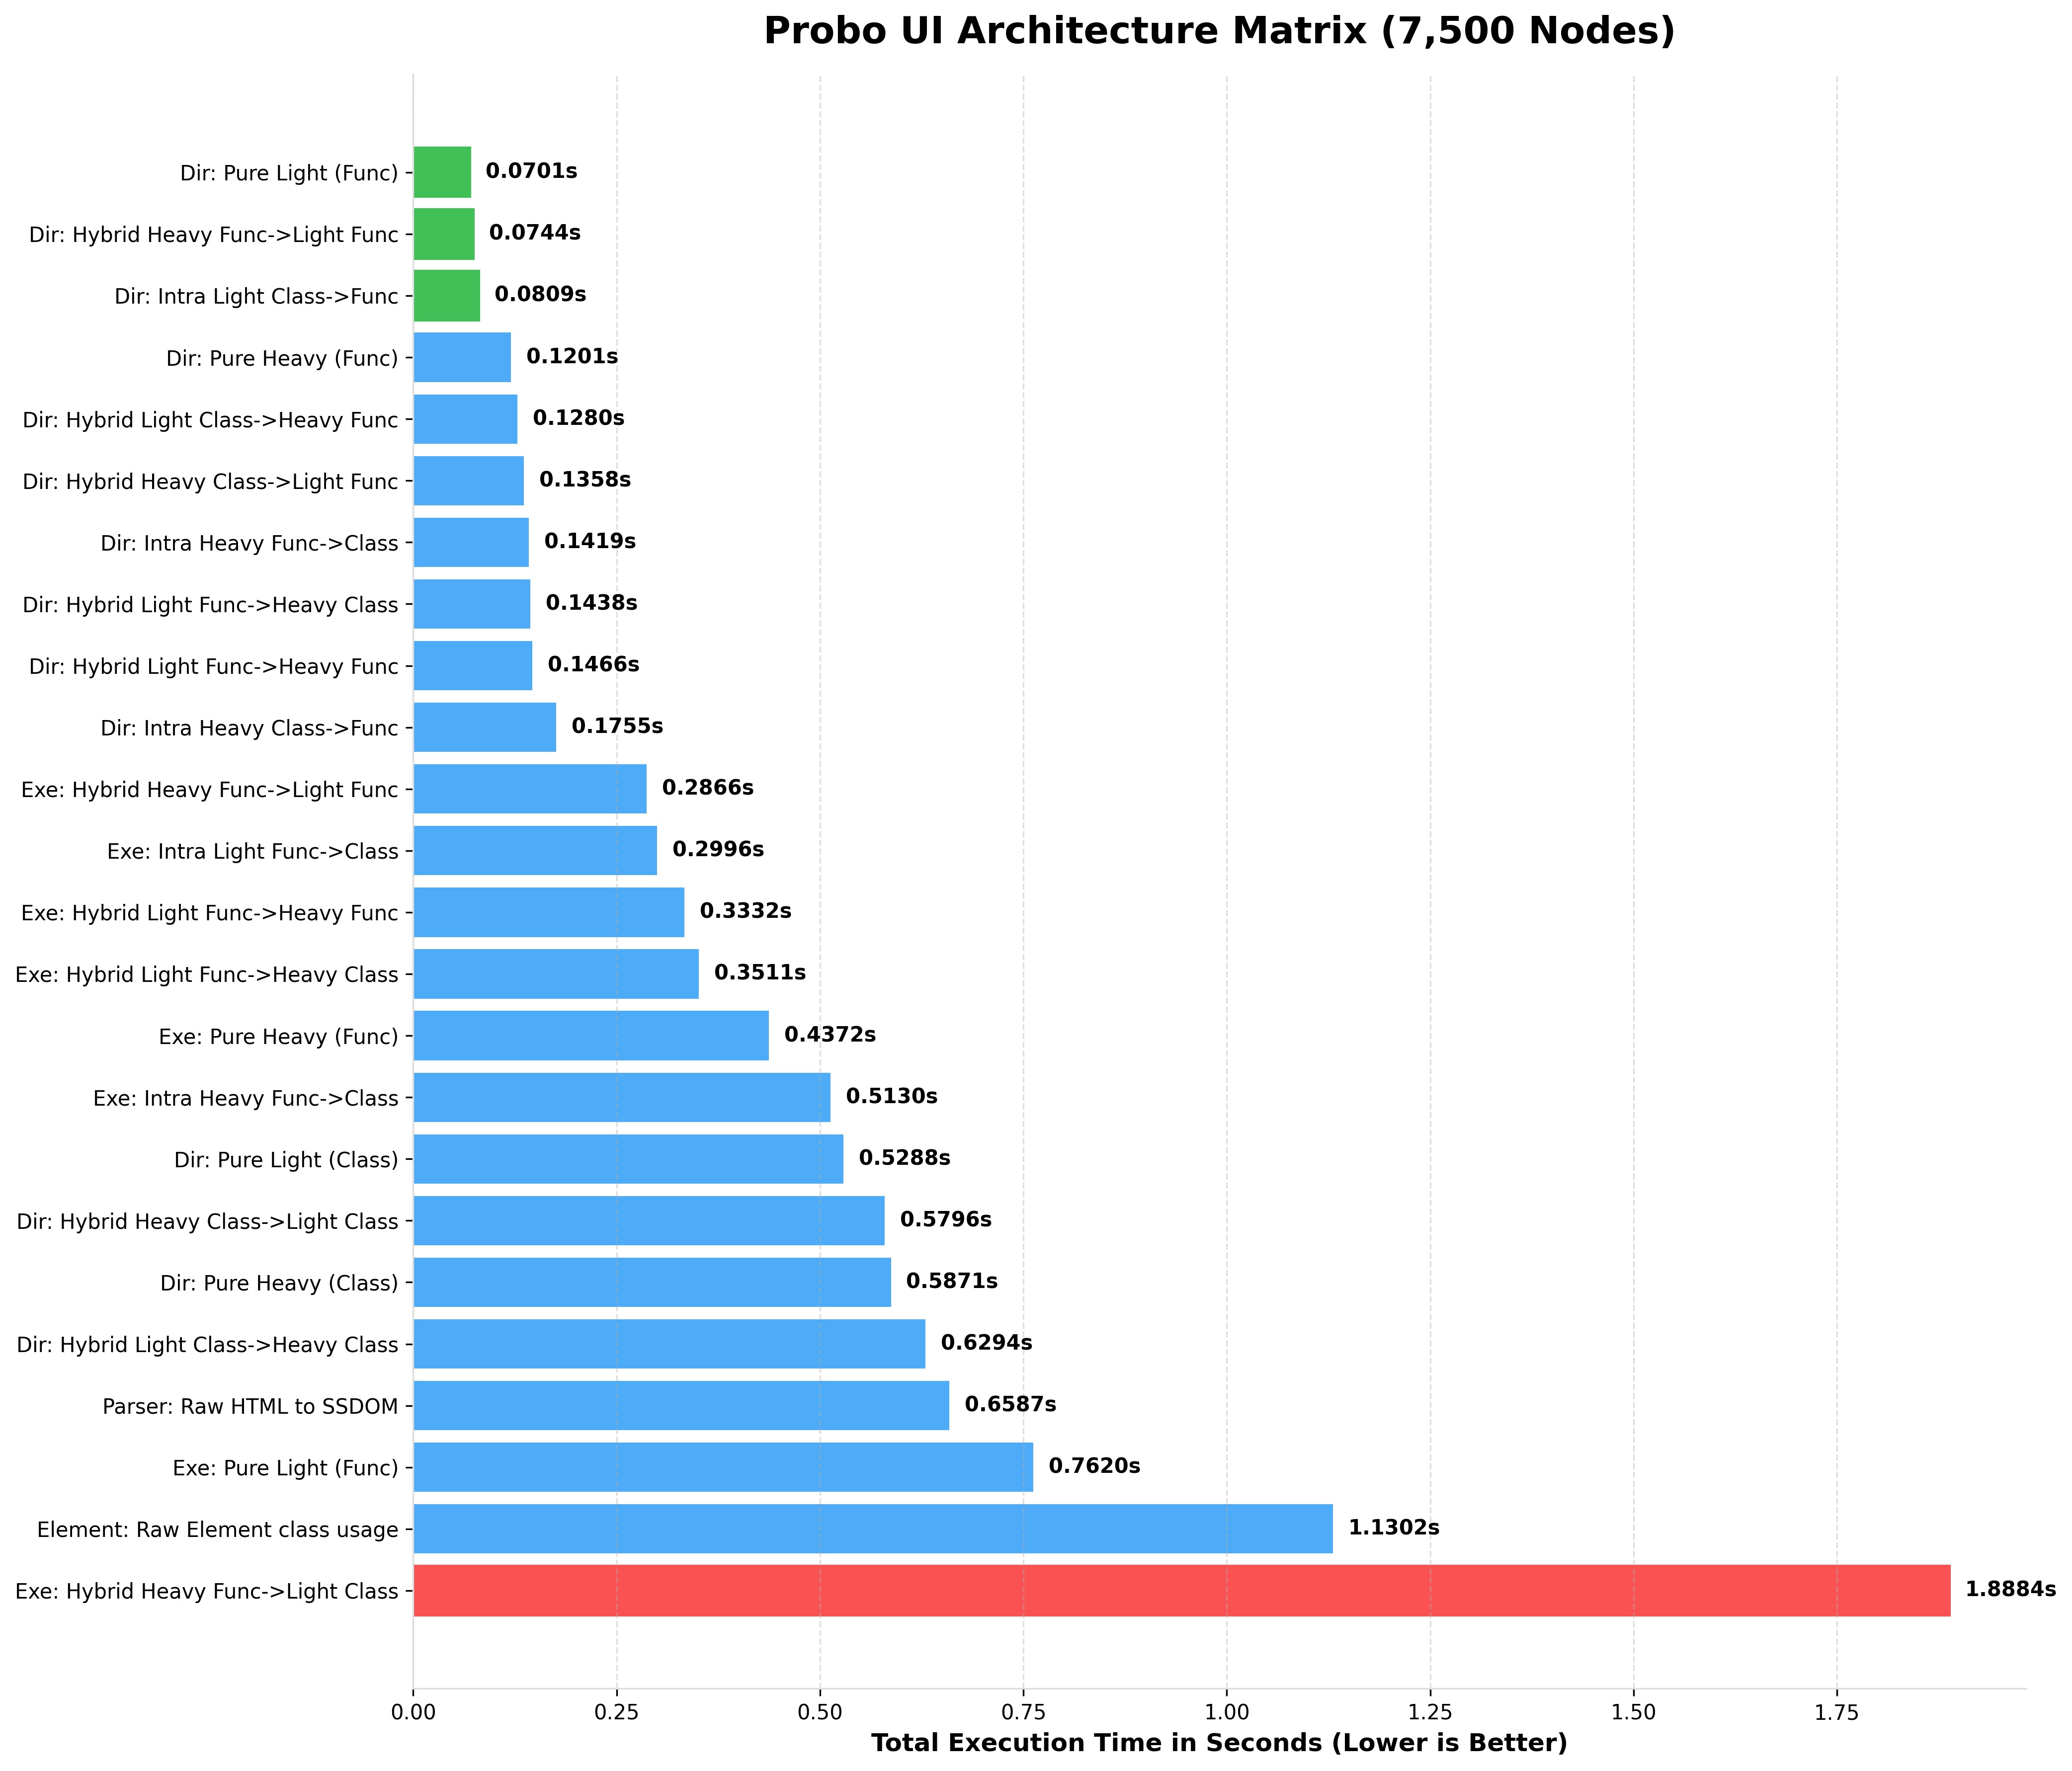
Notice how Pure Light (Func) completely dominates string parsing, while the Hybrid Heavy Class->Light Func (The Chimera Pattern) provides the perfect balance of OOP layout manipulation and lightning-fast data rendering.
Performance charts
BENCHMARKING 100 NODES (rendered HTML)
BENCHMARKING 1,000 NODES (rendered HTML)
BENCHMARKING 1,500 NODES (rendered HTML)
BENCHMARKING 2,000 NODES (rendered HTML)
BENCHMARKING 2,500 NODES (rendered HTML)
BENCHMARKING 5,000 NODES (rendered HTML)
BENCHMARKING 7,500 NODES (rendered HTML)
BENCHMARKING 10,000 NODES (rendered HTML)
BENCHMARKING 15,000 NODES (rendered HTML)
BENCHMARKING 20,000 NODES (rendered HTML)
BENCHMARKING 25,000 NODES (rendered HTML)
BENCHMARKING 50,000 NODES (rendered HTML)
BENCHMARKING 75,000 NODES (rendered HTML)